
by Philip Cafaro
In my experience teaching environmental ethics to college students and advocating for sustainable policies in the United States, the biggest obstacle to good discussions about population matters is ignorance about the numbers. How many people live in the United States? My students don’t know. Many environmentalists don’t know.
What will the US population be in 50 or 100 years, if fertility and immigration rates continue at current levels? What if they increase, or decrease: would that make a big difference, or not? Few Americans have any idea. That includes Presidential candidates proposing policy changes that could impact fertility levels substantially, or changes to immigration levels with potentially immense demographic impacts. Hence we sleepwalk into our demographic future.
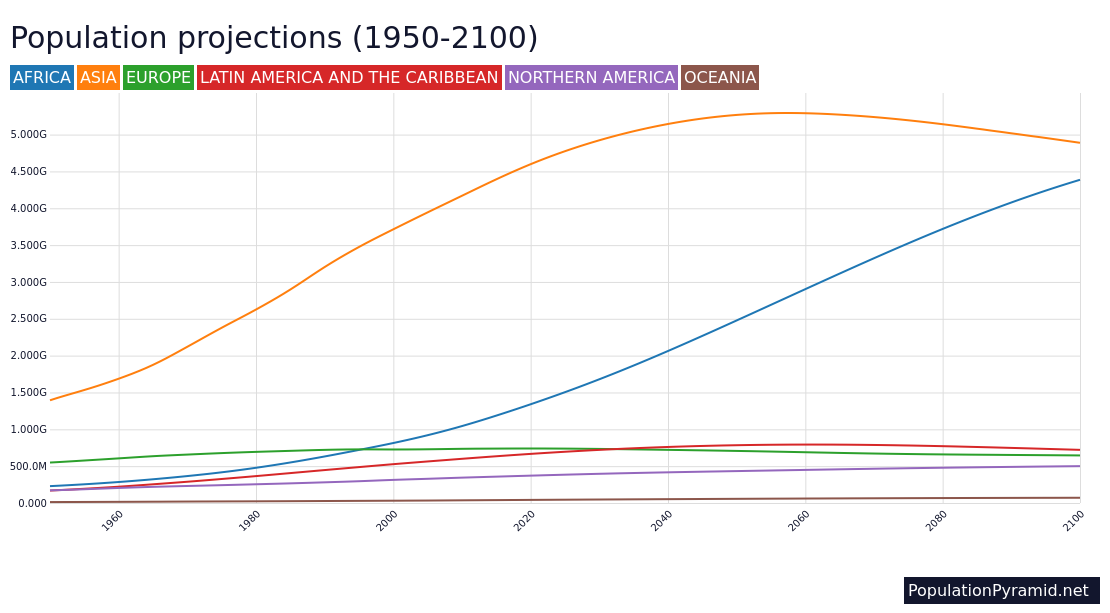
Are citizens of the European Union more demographically literate than Americans? I do not know. But thanks to software developer Balázs Forián-Szabó, they now have a great tool to increase their knowledge. Working with TOP researchers, Balázs has created an interactive animation of the population projections we recently published in Comparative Population Studies. We invite you to explore this new “TOP Grapher” which allows you to see population projections for all 28 members of the EU and the EU as a whole.
How do these projections differ from others, such as the UN’s most recent (2019) projections, or the efforts of the various national statistical bureaus? Most importantly, they are policy based, clearly linking current policy choices to future population sizes. For example, they allow users to compare the impact of more or less generous economic safety nets on future fertility rates, and in turn, the impact of higher or lower fertility rates on future national population sizes.
Most population projections are presented and received by the public as forecasts, so they tend to be judged on how likely they are to accurately predict the future. But this can lead to demographic fatalism, or complacency. In fact, the EU’s demographic future will in part be created by the choices of its citizens and policymakers. Our new projections do justice to this open-endedness; for example, by showing how choosing higher or lower immigration levels will influence future numbers. By projecting all the way out to 2100, our projections give a sense of how a full range of different policy choices will influence population sizes in the medium and long term.
Using the Top Grapher is easy. Click on the plus sign in the lower right hand corner to pull up a list of all 28 EU countries. Choose a country (or the EU as a whole), then choose among any combination of five different fertility and five different immigration scenarios to graph. You can also graph scenarios from two or more countries at the same time. When you have chosen which countries and scenarios you want to graph, click the X in the upper right hand corner and the TOP Grapher will run your customized graph.
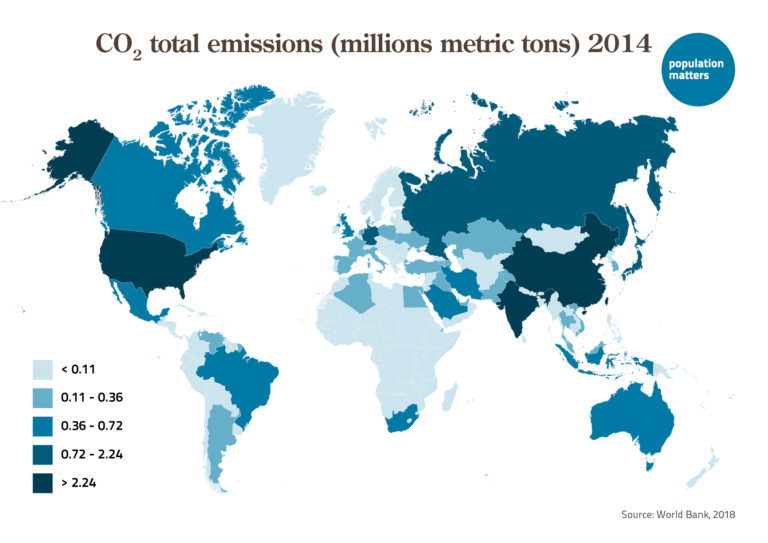
If you want to know the population for any year under any scenario, just move your cursor over the graph and you can see it. There is also a toggle switch in the upper right hand corner, allowing you to convert your results from population size to population density, or back. This feature should prove especially valuable to environmentalists, since some environmental impacts are primarily a function of total numbers (like greenhouse gas emissions), while others are more a function of changing population density (like biodiversity loss).
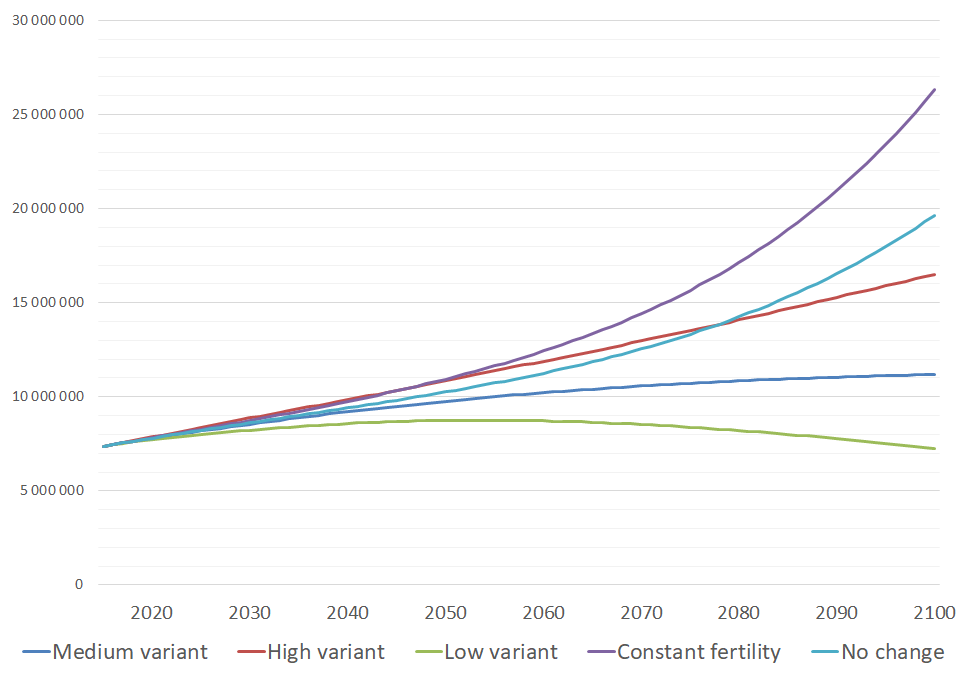
While the results of our population projections are broadly in line with other recent projections, their format provides a much stronger sense of the contingency and diversity of Europe’s demographic future. While news accounts typically focus on “Europe’s declining population,” our projections show that many EU nations are set to continue growing, some substantially.
Did you know that under status quo fertility and immigration policies, Germany is set to be replaced as Europe’s most populous country before the century is out? To find out by whom, click on the status quo scenarios for the four most populous EU countries (Germany, France, the UK and Italy) and run the graph.
Wondering whether your country is set to grow or decline? How many million people doubling France’s immigration level would add to its population by 2080? Whether cutting Holland’s or Hungary’s immigration in half while improving their family support services would lead to bigger or smaller populations than their status quo policies? Well, wonder no more. Run the numbers for yourself!
For questions about our projection model and the scholarship behind our projections, see our paper “Policy-based Population Projections for the European Union: A Complementary Approach” We would love to receive your suggestions for new features or improvements to these animated projections, or questions about them.
Do you want to learn more about the solutions for overpopulation and actions towards sustainability? What actions we need to take on individual, community, national and global level? Check out the Overpopulation Project’s list of solutions!


Leave a Reply