
A new report from Earth4All says world population will peak below 9 billion. While it celebrates this result and says we must work to get it even lower, this unrealistically low projection itself is likely to have the opposite effect.
by Jane O’Sullivan
Last week a consortium under the name of Earth4All published new population projections, as part of a larger exercise in mapping out a sustainable future for humanity. The team includes members of the Potsdam Institute for Climate Impact Research, Stockholm Resilience Centre and the BI Norwegian Business School. The report has been sponsored by the Club of Rome, as a follow-up to its famous 1972 Limits to Growth study, featuring MIT’s then-groundbreaking Earth3 model. Earth4All is a creative extension of Earth4, intended to be Earth3’s successor. The publication has been widely reported, including in New Scientist and the Guardian, and the authors placed an article in Project Syndicate.
It is gratifying to see Earth4All emphasise the importance of a lower peak population to achieving sustainability. They even stress that rapid action is needed to shift course, even if the impacts of that change in course take decades to emerge. But these valuable messages are undone by an unrealistically low population projection, bound to breed complacency. All the headlines emphasised the lower peak population, not the need for action to get it lower.
The Guardian said, “World ‘population bomb’ may never go off as feared.” I’m not sure what they imagine the population bomb going off to look like, if they can’t see that, with six of nine planetary boundaries for sustainable environmental impact already exceeded, it already has!
I have two main concerns with the Earth4All population projection. Firstly, it uses GDP per person as the main driver of fertility levels. Secondly, it is even worse at describing recent reality than the UN’s model. Together, these issues place it firmly in the realm of fairy tale.
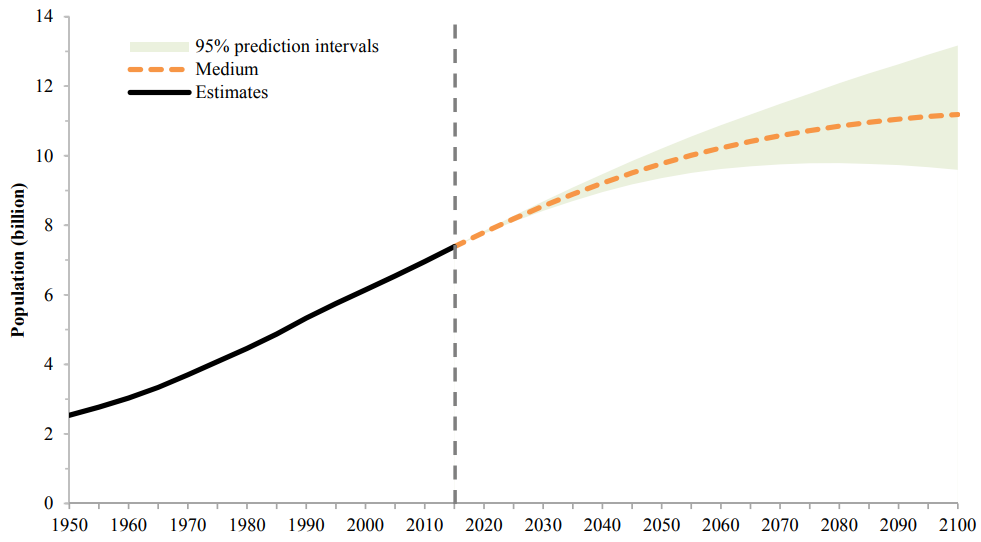
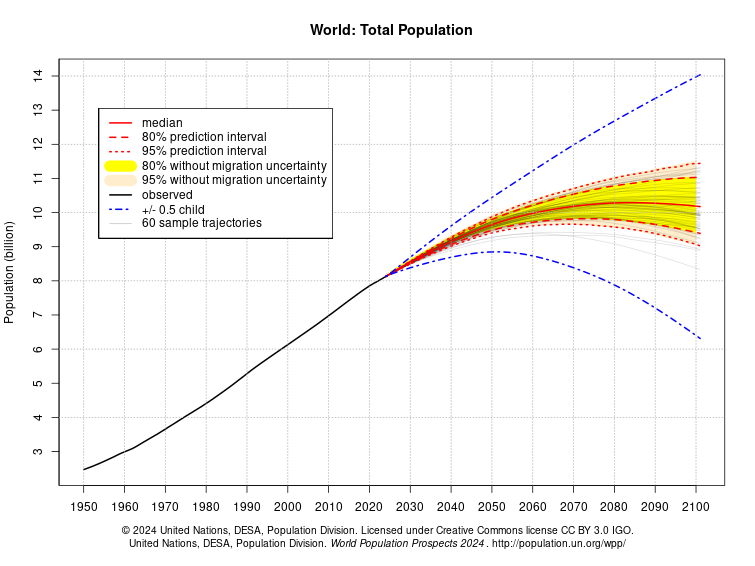
Earth4All’s ‘business as usual’ projection (aptly named “too little too late,” or TLTL for short) is around the level of the UN’s ‘low fertility’ projection and the Wittgenstein Centre’s SSP1. In their chart, reproduced below, these correspond to the bottom edge of the grey and pink shaded areas, respectively. The proactive scenario, named “Giant Leap” (GL), gets birth rates down even faster and further, and sees global population decline at a cracking pace of 1.2% per annum.

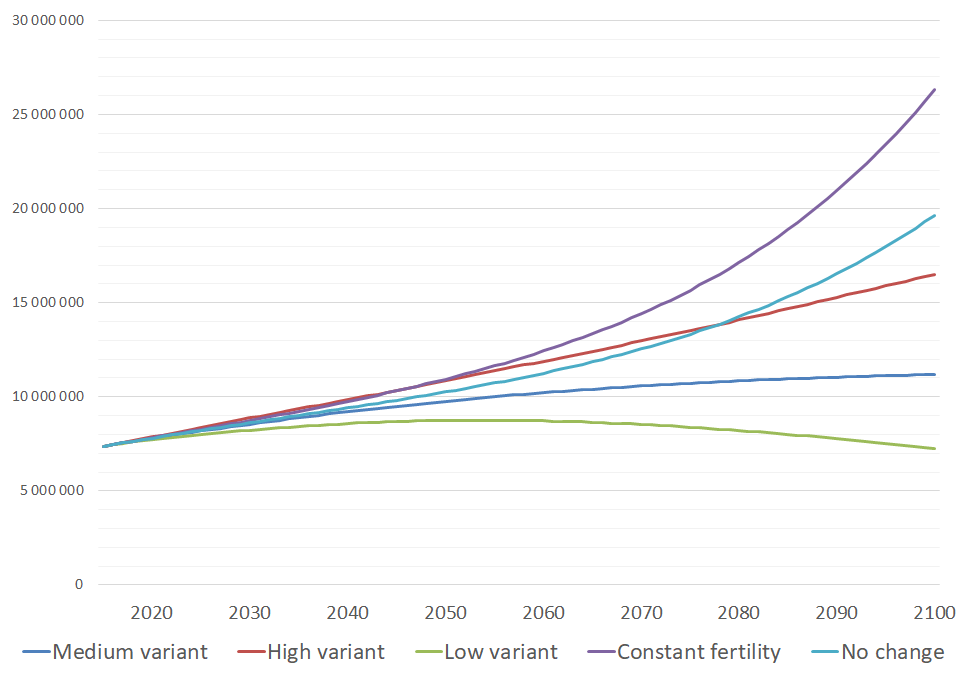
To present such a low ‘business as usual’ projection is not credible to me. Neither the UN-low fertility scenario nor SSP1 depict a realistic pathway of fertility decline: both simply ramp fertility down to a set amount below their standard projection (see chart below). The UN is quite open about the low- and high-fertility scenarios’ non-realistic quality, explaining they merely illustrate the impacts of higher or lower fertility. The Wittgenstein Centre is less transparent about it, instead presenting it as a result of more effective development efforts. But even the most optimistic assumptions about African development can’t explain why their fertility would fall well below the levels generally seen in the developed world. The slow decline in fertility in Sub-Saharan Africa is related to persistently high fertility desires, despite increasing urbanisation and ‘development’ in the region.

When the new UN revision came out last July, I explained how the UN’s projections over the past decade have persistently underestimated recent global population, due to their over-anticipation of fertility declines in high-fertility countries. The UN’s 2022 data release further demonstrated how off-the-mark are the lower projections by Wittgenstein Centre and the IHME. The chart below shows how the UN has had to revise upward its fertility estimates for Africa. Despite this slower-than-expected decline in the past, it nevertheless is projecting steeper decline in the future.

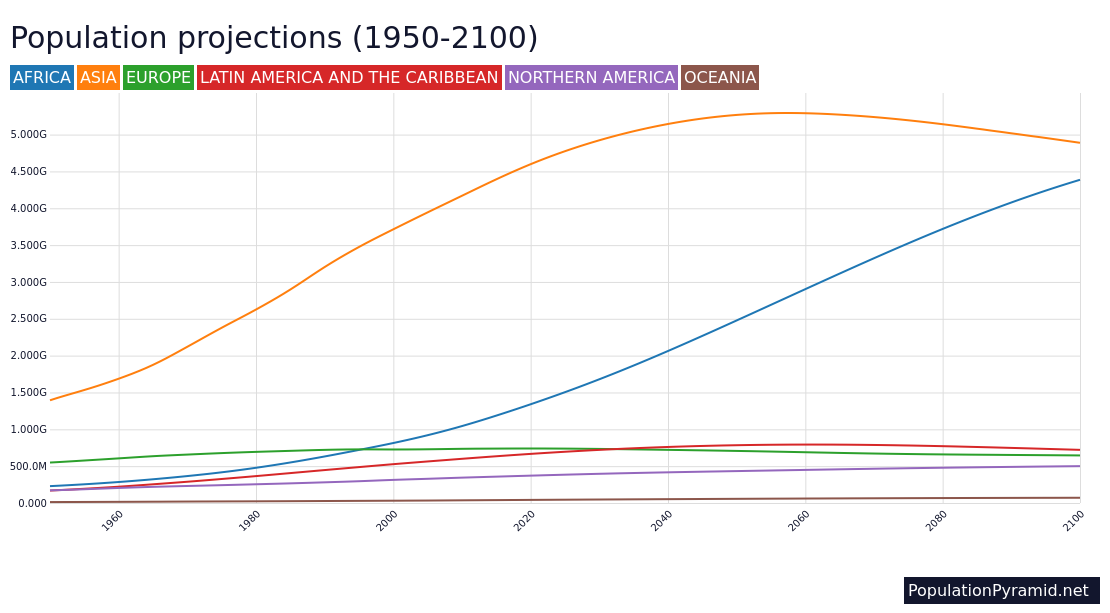
I can’t show you the Earth4All fertility data because they don’t report it. Only crude birth rates (CBR) are given. This presents a challenge to interpretation, as CBR’s relationship to fertility depends on the age profile, which is in turn affected by the rapidity of past fertility and longevity changes as well as by migration rates. Migration rates are not reported, but are clearly present in the model: in the ‘business as usual’ scenario, USA’s population increases and Europe’s is roughly stable throughout the century, which is almost certainly due to immigration.
But, from what we can glean from the CBR data presented, the picture is confusing. Sub-Saharan Africa, for instance, rapidly descends from a CBR around 35 per thousand to around 6 by the end of the century. In the proactive scenario, it reaches roughly 2 per thousand. Such a low birth rate means fertility well below one child per woman, together with a very elderly-heavy age profile. Latin America, whose fertility transition has been relatively slow (which also means less dramatic ageing), is inexplicably expected to reach even lower CBR. Meanwhile, today’s low-fertility regions settle in with CBR around 9, and the Middle East around 15.
Similarly bewildering are the different rates of population decline in different regions. Sub-Saharan Africa’s decline would exceed 2.2% per year, due to their phenomenally low birth rate. In contrast, China descends at a gentle 0.8% per annum, although up to about 1.1% in the GL scenario, while Eastern Europe declines around 0.7% and 1.2% per annum for the two scenarios. These are the regions I would expect to have both low fertility and low immigration, and hence the most rapid declines. (Japan and South Korea would present an even more dramatic example, but Earth4All have unhelpfully lumped them together with the demographically different Canada, Australia and New Zealand in the “Pacific” region.)
Flawed assumptions about drivers lead to flawed policy recommendations
The report criticises the UN methodology, saying it “does not shed any light on the causal mechanism … and its evolution over time.” While this is true, they do not ask in which direction the UN’s projections have been missing the mark, and what change in drivers could explain this.
Instead, they reason that GDP per person is a good proxy for all the drivers together: “In this context, GDP per person is to be understood as a proxy for a number of key factors, such as female education, access to contraceptives and socio-economic mobility. The theoretical justification is that the ongoing demographic transition is not related exclusively to educational attainments and the availability of contraception, but more generally to the global adoption of a set of lifestyles consistent with lower fertility rates.” However, this ignores the connections between birth rates, patriarchy, religion and other embedded social norms in high-fertility countries.
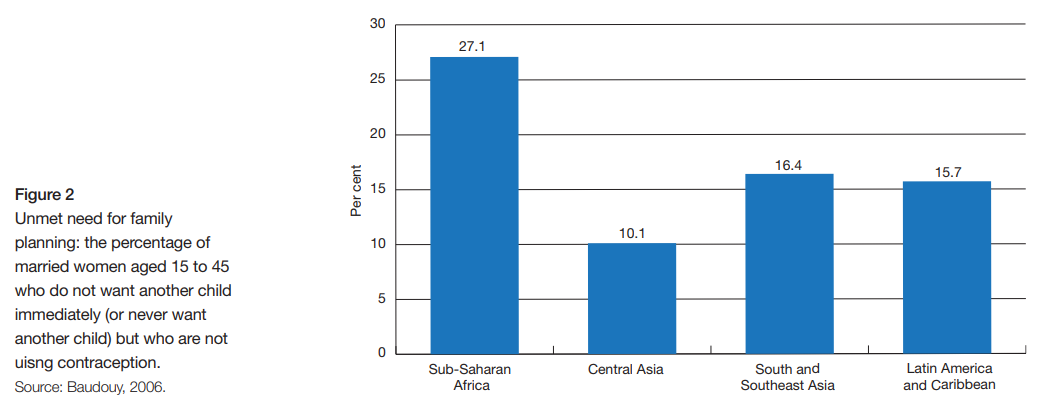
Furthermore, Earth4All don’t explain the calibration of this negative correlation between GDP per capita and fertility. In one quote, they worryingly indicate that they applied a linear model, rather than the asymptotic one depicted in their Figure 2, writing: “Left uncorrected, the negative relationship between GDP per person and fertility rate leads to a steadily decreasing birth rate, eventually resulting in near-zero birth rates (i.e. human voluntary extinction by wealth before 2300).” To avoid this, they apply a floor, “whose value is calculated on the basis of present data” but is not revealed to us. For any region to reach a CBR as low as two suggests this floor is too low.
However, the much bigger problem is that in reality, income is not correlated with the pace of fertility decline (see Chart A below). Earth4All discuss how different assumptions about drivers affect policy recommendations: “A comparison with the augmented DICE model and the Lancet approach can illustrate the issue. If the ‘fertility as consumption choice’ approach is taken, then demographic policies must be focused on the only parameter that could be directly influenced, namely the cost of raising children, which, barring policy intervention, is assumed to be linear in capital. If, instead, the Lancet approach is favoured, then the key variables to be taken into account by policymakers become education attainment and contraceptive supply.” Their own assumption leads to the recommendation that redistribution of resources to relieve poverty will do the trick. It is an equally flawed view.
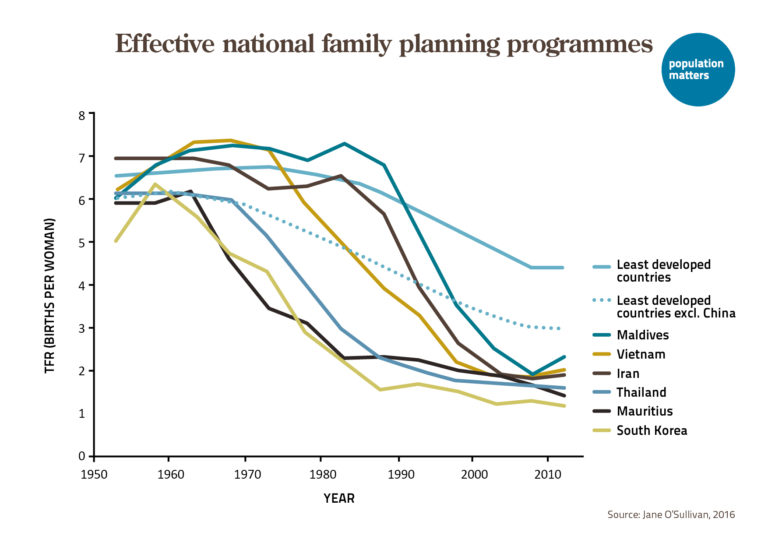
Overwhelmingly, the dominant determinant of fertility decline has been family planning program effort. In country after country, voluntary family planning programs not only have provided the means to avoid unwanted pregnancies, but also reduced desired family size, independent of income or education. The “adoption of a set of lifestyles consistent with lower fertility rates” is not brought about by income alone, as we have seen in the Middle East, nor even by education unless it teaches family planning. It requires strongly embedded cultural norms around family size and gender roles to be questioned and shifted. No country has achieved a rapid fertility transition without promoting smaller families. Even girls’ education is a relatively weak driver, in the absence of family planning promotion. If it was change in incomes and education that the UN’s model was failing to account for, it would be overestimating, not underestimating global population growth. The withdrawal of family planning promotion since the mid-1990s (following the 1994 UN Conference on Population and Development in Cairo) is a more plausible explanation for the UN’s repeated upward revisions.
If income does not drive fertility decline, what is the explanation of the evident correlation between fertility and income? Clearly it is because lower fertility enables more rapid economic development. This reverse causation is systematically ignored or denied in the ‘post Cairo’ era. The astounding successes of past family planning programs in putting poor countries on a path to enrichment has been air-brushed out of the post-Cairo rewritten history.
The thoroughness with which the value of population growth reduction for development has been silenced leads to serious misconceptions, such as this throw-away line in the Earth4All report: “a quicker demographic transition brings its own challenges, particularly of inequality …” Clearly, it is the persistence of population growth, not its reversal, that most exacerbates inequality.
The corollary of not acknowledging that lower fertility enables economic development is not acknowledging that it is near impossible to reduce poverty when fertility is high. Any strategy that relies on reducing poverty first is bound to fail, if no effort is made to promote small families in high fertility communities.
The charts below assemble data for each country in five year periods from 1960 to 2010. Boxes span 25th to 75th and whiskers extend to 10th and 90th percentiles. Graph A shows that there is no relationship at all between per capita GDP and the rate of fertility decline. Graph B shows that countries that reduced high fertility levels the most had the highest increases in per capita wealth, while countries where fertility levels have remained above four have simply failed to progress.

There are plenty of admirable sentiments and proposals presented in the Earth4All report. The ‘Giant Leap’ scenario calls for much higher taxation of the rich, to fund social programs, and a $1 trillion per year green jobs fund for low income countries. They also advocate $1 trillion per year for new renewable energy infrastructure. Eye-watering figures, but not unimaginable when gross world product is around $100 trillion. Just very hard to locate the seeds of political will for such coordinated philanthropy in today’s political landscape. Their assumptions about the feasible environmental gains from agricultural transformation are more implausible to me, including a radical reduction in fertiliser use without reducing food production, and a rapid increase in soil carbon from adoption of conservation tillage, which is already widely used with variable impacts on soil carbon.
Maybe there is some truth in the belief that too much negativity about the future will only make people disengage. But too much rosy optimism is at least as likely to dissuade action. Underestimating future population growth will not help us avoid the consequences. Misrepresenting the factors driving fertility perpetuates the neglect of the policies and programs that are most effective. And declaring that “humanity’s main problem is distribution rather than population” does not help the bottom billion, for whom the Malthusian Trap is tightening.


Leave a Reply