
Whether you see a peak and decline of world population as a good thing or a bad thing, lots of people are speculating that it is imminent. Can we believe them?
Jane O’Sullivan
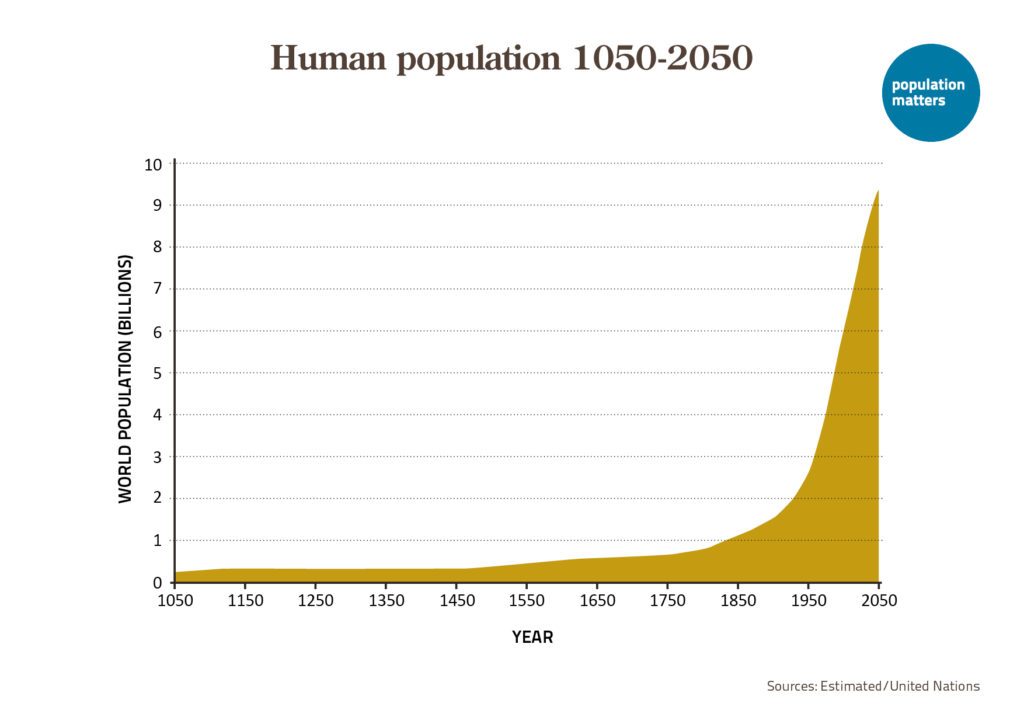
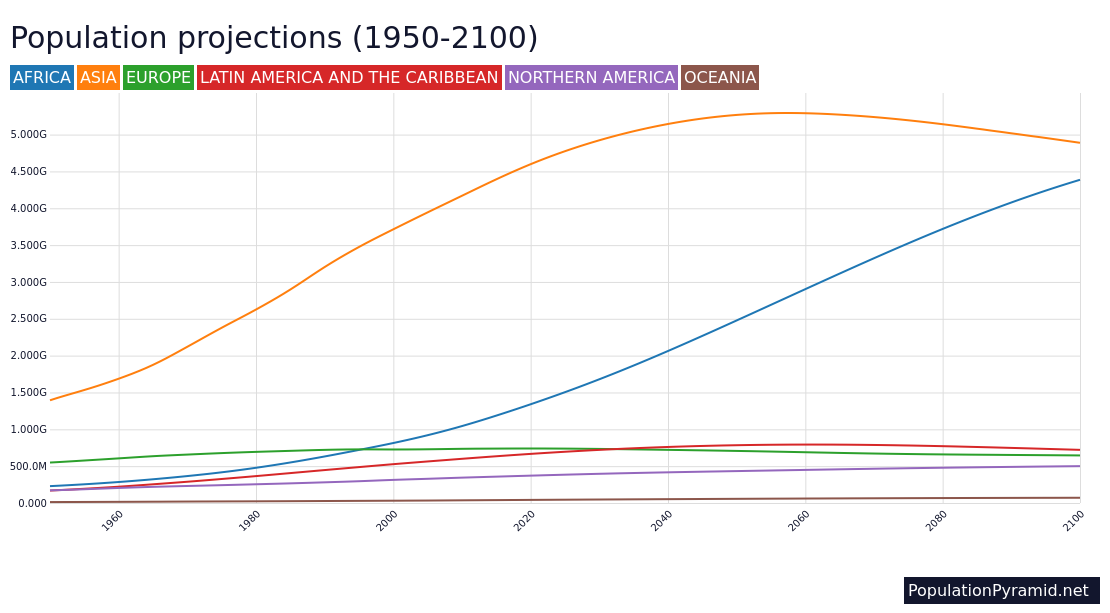
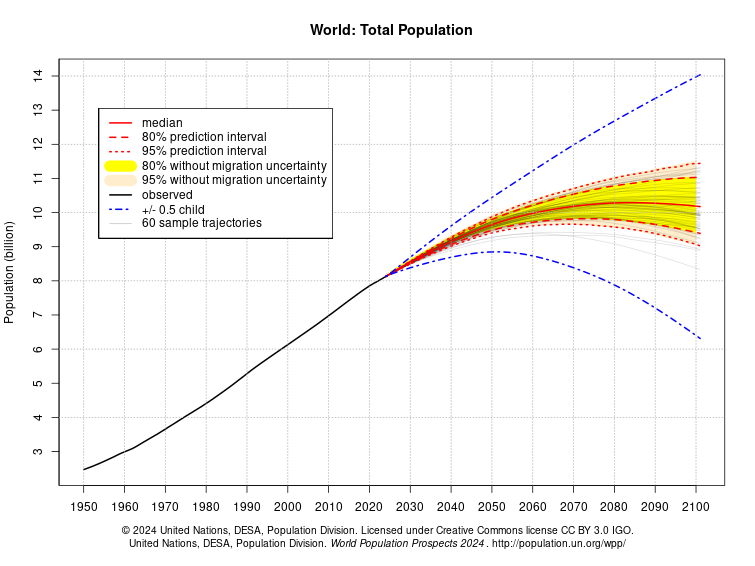
According to the most recent United Nations projections, the world population will peak sixty years from now at around 10.3 billion. Lately, we have seen many articles speculating that world population might start declining much sooner than the UN has projected.
Often cited is the news that more than half the world’s population now live in countries with below-replacement fertility. This is stated as if it is both surprising and crucial evidence of imminent population decline.
What does this statistic tell us, if anything?
The moment India reported that it had reached a total fertility rate (TFR) below 2.1 children per woman, a sixth of the world population moved from living in a country with above-replacement fertility to living in one with below-replacement fertility. This happened in 2020, bringing the proportion of world population in below-replacement fertility countries from just under half to a full two-thirds. This event was a long time coming and marked no radical change in the world’s demographic prospects. Even within India, a majority of districts still have above-replacement fertility.
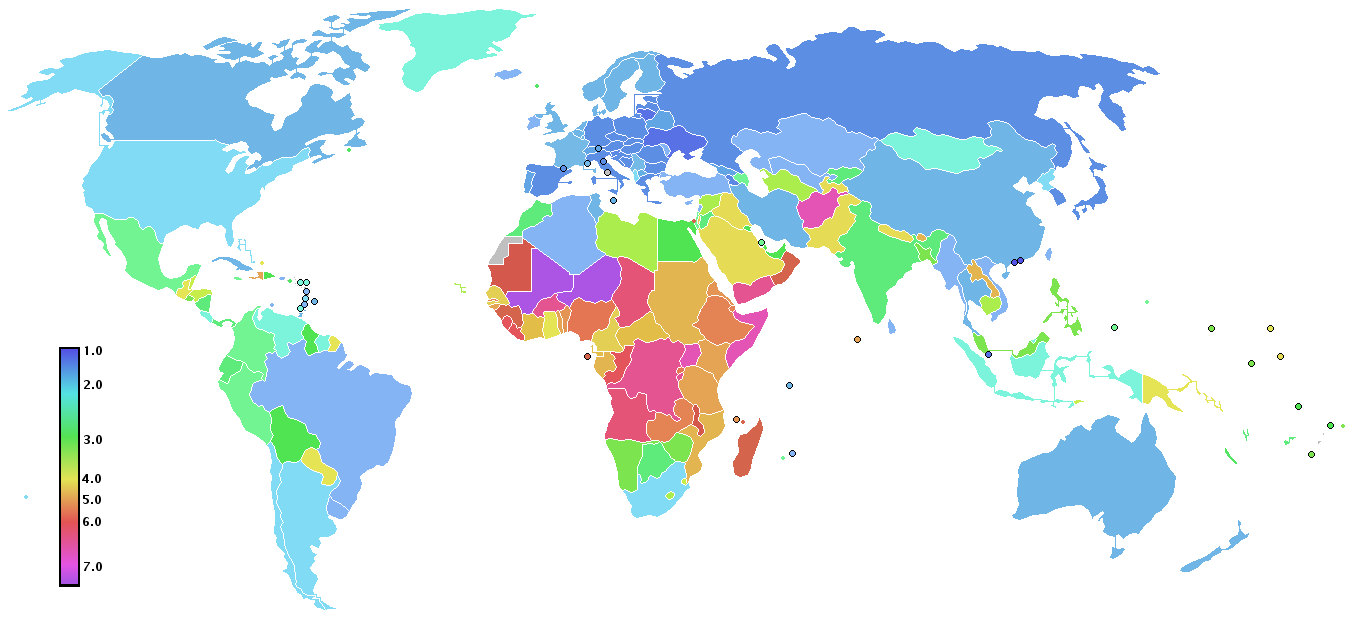
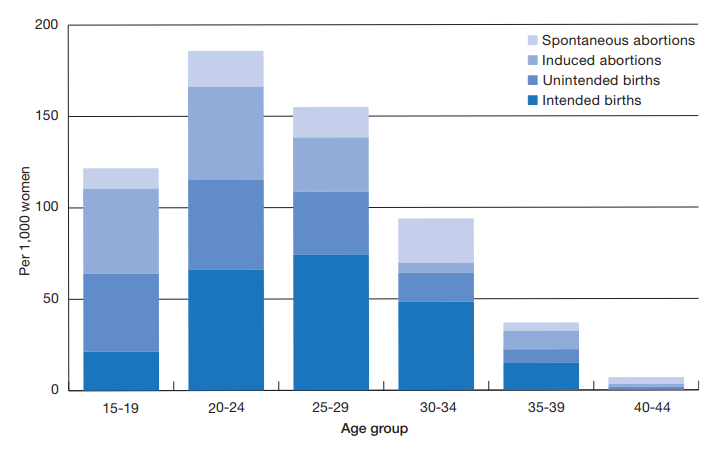
What is more important for future population trends is where births are occurring. As Figure 1 shows, more than half of all births continue to be in countries with above-replacement fertility. Moreover, according to the UN’s medium-variant projection, this will still be the case in 2050. So for decades to come, most young adults coming into their reproductive years will live in societies with fertility rates above replacement.

It’s worth contemplating that the majority of children born this century will a) live in poor countries with growing populations, b) require much more resources and energy if they are to be lifted out of poverty, and c) must choose to have, on average, fewer children than their parents for the UN’s projection not to be greatly overshot.
Are UN projections under-rating recent fertility declines?
Another focus of current commentary is that, in many countries, fertility has fallen recently, below previous expectations. This is taken to mean a sooner and lower peak global population. Some of this drop has been attributed to a transitory response to the Covid-19 pandemic, but in many places the trend apparently preceded the pandemic.
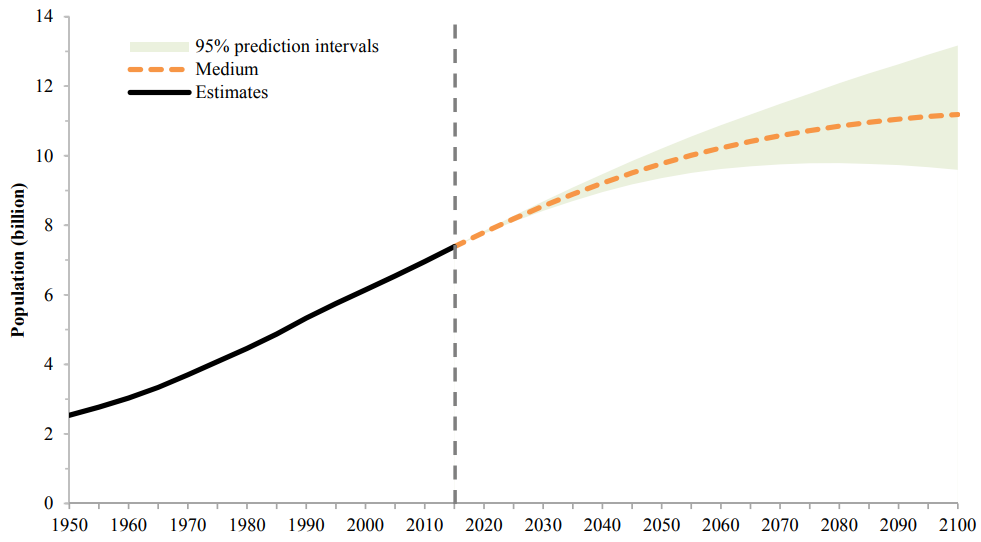
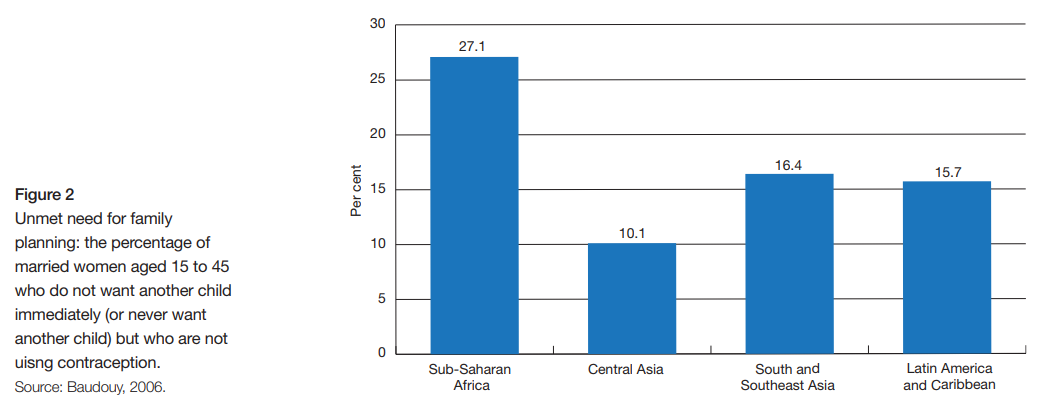
Tom Murphy’s “Do the Math” blog explored this argument at some length here, here and here. His analysis is pretty sophisticated and I don’t doubt the robustness of the model he has constructed. For low-fertility regions his scenario is not unreasonable: that the falling trend will taper off gradually, and fertility will thereafter stay low, in contrast with the UN’s projection retaining roughly current fertility (Figure 2). What I find less convincing is his extrapolation of Africa’s fertility, which he imagines falling below replacement rate around 2050, compared with around 2090 in the UN’s model.

Murphy is absolutely right that recent fertility downturns in other regions are not reflected in the UN’s medium projection. He is spot on to point out that a projection that suddenly changes course from recent trends is suspect. But in the case of Africa, the UN’s projection has no such inflection point to justify Murphy’s much steeper decline.
In fact, as we have noted previously on this blog, high fertility countries in Africa and elsewhere have tended to progress more slowly than the UN has been modelling. As a result, UN projections have consistently underestimated recent world population growth.
The reality is that a few smallish low-fertility countries lowering fertility by a few tenths of a child don’t make up for a few largish high-fertility countries failing to lower births as fast as anticipated.
High-fertility countries have a disproportionate influence on future population
To explore this dynamic, let’s divide the world into low-fertility and high-fertility countries. Since high-fertility countries tend to be poor, the World Bank’s income group classification gives a crude division. Conveniently, the UN includes this grouping in its population tables. The “High-and-upper-middle-income countries” all had a GDP per capita above $4,515 in 2023 and “Low-and-Lower-middle-income countries” came in below that figure. In 2024, both groups had a similar total population, just over 4 billion. While the richer countries had an average fertility rate of 1.48, the poorer country group averaged 2.87, according to the UN.
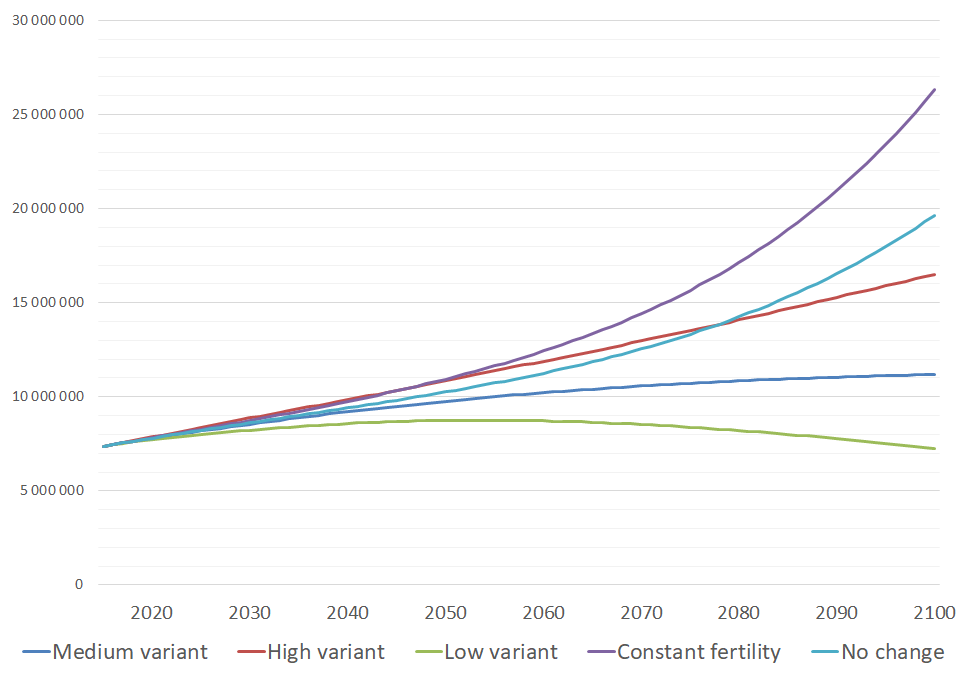
If Murphy is right about the recent fertility decline in richer regions becoming a persistent trend, this would roughly resemble the UN’s “low fertility variant” projection. In that projection, all countries rapidly shift to a fertility rate half-a-child lower than the present trend, and then parallel the UN’s medium projection, remaining half-a-child lower. While the medium fertility projection expects their population to shrink by 800 million by 2100, the low fertility projection would see them lose an additional 1 billion people (Table 1). (Note that the UN assumes net migration to rich countries will be much lower than recent levels.)
In contrast, if high fertility countries take longer to reduce their fertility than the UN projects, what difference would this make? If these countries followed the UN’s high-fertility variant, they’d end up with 2.8 billion more people than in the medium projection.

This is a very crude assessment. Each of these income groupings contains countries with very different circumstances. Also, the UN’s “high-fertility variant” projection is unrealistic, not varying the rate at which fertility declines but merely stepping up the starting position. Nevertheless, it is a plausible representation of recent trends, and we can see how much the outcome depends on the high-fertility countries.
Case study: Nigeria
I was curious to know how a higher or lower rate of fertility decline would affect these population projections. I have explored this in Figure 3, taking Nigeria as a case study.
I took the UN’s medium projection and recorded the relationship between the level of fertility and the rate of fertility decline. (As fertility declines, so does its rate of decline in the UN’s model, resulting in those curves getting less steep with time. I used a sigmoidal model to fit the curve.) I then generated fertility time courses using half or three quarters the rate of decline compared with the UN’s projection. I used these fertility projections to project the population using Spectrum’s DemProj model. I found that the UN’s high-fertility projection is roughly equivalent to two thirds of the UN’s projected rate of fertility decline.

Since the UN’s estimate of Nigeria’s fertility was substantially lower in the 2024 revision than the 2022 version, I checked Nigeria’s National Statistics Bureau for their latest official estimate. The Demographic Statistical Bulletin 2022 appeared to be the latest, and it said, “Total Fertility Rate (TFR) moved from 5.50 in 2013 to 5.14 in 2022.” This corresponds with the UN’s 2022 revision, while the 2024 revision says Nigeria’s fertility was 4.55 in 2022. According to Nigeria’s statistics bureau, fertility has been falling steadily at 0.04 units per year, while the UN models it at more than double this pace.
Since the UN’s sharp downward revision of Nigeria’s fertility remains under suspicion, I included a projection of the trend published in Nigeria’s Demographic Statistics Bulletin, starting from 5.14 in 2022 and maintaining a steady decline of 0.04 units per year (Figure 3, ‘Continued trend’). This pace takes 25 years to fall by one unit, reaching replacement rate fertility at the end of the century. The resulting population in 2100 (Figure 3B) is double the UN’s medium projection, and still a long way from peaking.
It’s difficult to see where the UN’s lower figure comes from. In most African countries, the most reliable estimates come from UN-assisted Demographic and Health Surveys (DHS), but these are conducted infrequently. Nigeria’s National Statistics Bureau seems to have extrapolated from the 2013 DHS (TFR=5.5) and the 2018 DHS (TFR=5.3) to reach their estimate for 2022. The DHS database lists a more recent estimate of Nigeria’s TFR of 4.8 in 2021, but this figure is from a Malaria Indicator Survey (MIS) which are smaller and less reliable than DHS. Even so, this is still above the UN’s figure of 4.64 for 2021. As Figure 3 shows, modest differences in the starting point and rate make big differences in population outcomes.
The upshot
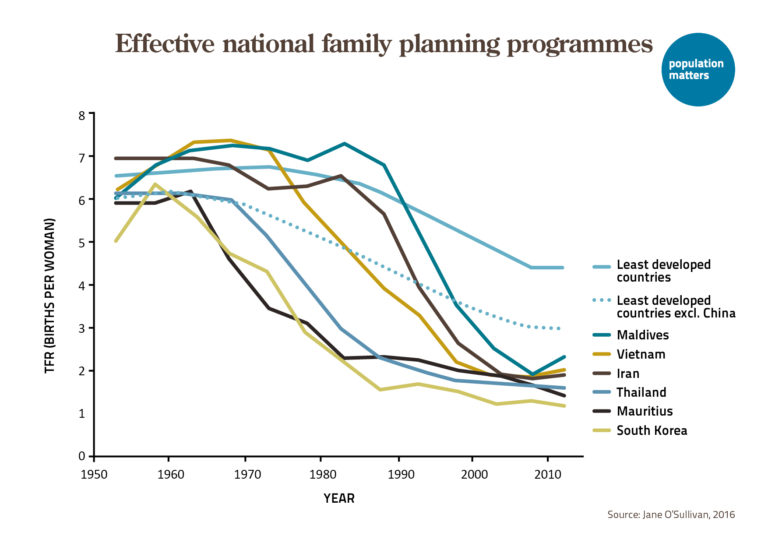
Is Africa entering a new phase of accelerated fertility decline, as the UN’s model and other, more optimistic demographers depict? I sincerely hope so. There are positive signs of increased attention to family planning by some African governments. But we simply don’t yet have hard data to show that this trend is underway. As the Nigerian example shows, UN data is not as ‘hard’ as it is generally assumed to be.
The upshot of all this is that I have very little confidence that world population will peak sooner and lower than the UN predicts. Unless high-fertility countries have much greater promotion and provision of voluntary family planning, within culturally sensitive programs that shift social norms around the rights and roles of women, I believe it is more likely to continue exceeding the UN’s projection, as it has done consistently this century. However, as more and more destitute people are added to the most destitute places on Earth, population could be curtailed by massive mortality events, most likely from violent conflicts triggering disease and starvation among displaced people. The complacency shown toward their fate by people more concerned about low fertility and whether empty houses will litter European towns is a constant source of dismay.


Leave a Reply