
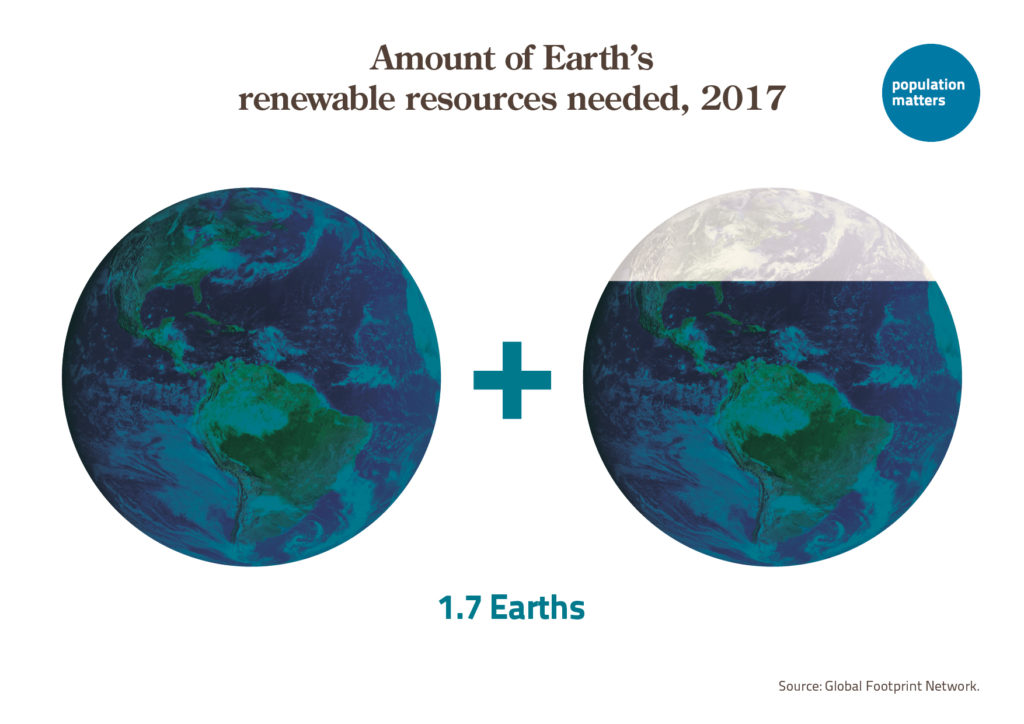
Every year on Earth Overshoot Day, a table becomes very popular, showing the number of Earths needed to be ecologically sustainable if all the people in the world had the same ecological footprint as the average citizens of various countries. This is computed by fixing the world population at the current value and varying the per capita ecological footprint. This time, we fix the per capita ecological footprint at the current world average and vary the population. This allows us to present a different table, showing the number of Earths needed to be sustainable if the entire world was as densely populated as various countries.
by Lucia Tamburino
August 22 is Earth Overshoot Day, when humanity’s demands for ecological resources and services exceed what Earth can regenerate during the whole year. Starting August 23, every further resource we consume represents subtraction from Earth’s natural capital: soil will be lost, natural resources won’t renovate, carbon emissions won’t be sequestered by natural ecosystems. To make an analogy, it’s as if you’ve already spent as much money as you earn in the entire year. All the extra money you’ll spend from now on will erode your capital. Of course, this way of living is not sustainable in the long term: you can do it only as long as you have capital left, or somebody gives you credit. When your capital is exhausted and your credit dries up, you go bankrupt. When dealing with money, bankruptcy is a problem; when dealing with natural resources, it’s a catastrophe.
There is a familiar table that the Global Footprint Network prepares every year for Overshoot Day. This table shows the number of Earths needed to be sustainable if all people in the world had the same per-capita ecological footprint as India, Brazil, the USA or any other country (Table 1).

The ecological footprint (hereafter EF) was introduced by William Rees and Mathis Wackernagel in the 1990s as a measure of people’s environmental impact [1,2]. With respect to other indicators, it has at least a couple of advantages. First, it is fair because it is based on consumption, including imports, hence internalising any eventual displacement of environmental impact outside national borders [3,4,5,6]. Second, the EF is directly comparable with biocapacity, as it is expressed in the same unit: global hectares (gha). The biocapacity of a particular area represents its “capacity to produce biological materials used by people and to absorb waste material generated by humans.” The EF hence provides a simple criterion to understand whether a country is ecologically sustainable: if its total EF (per capita EF x population) is below its biocapacity, the country is sustainable, otherwise not.
From Table 1, we can learn that if all the people in the world lived as in India, we would only need 0.72 Earths to be sustainable, while if all people lived as in Norway, we would need 3.4 Earths. The information is correct and important. Nevertheless, it is partial and to some extent misleading. I know many people who, based on this table, draw the wrong conclusion that India is ecologically sustainable, and Norway is not.
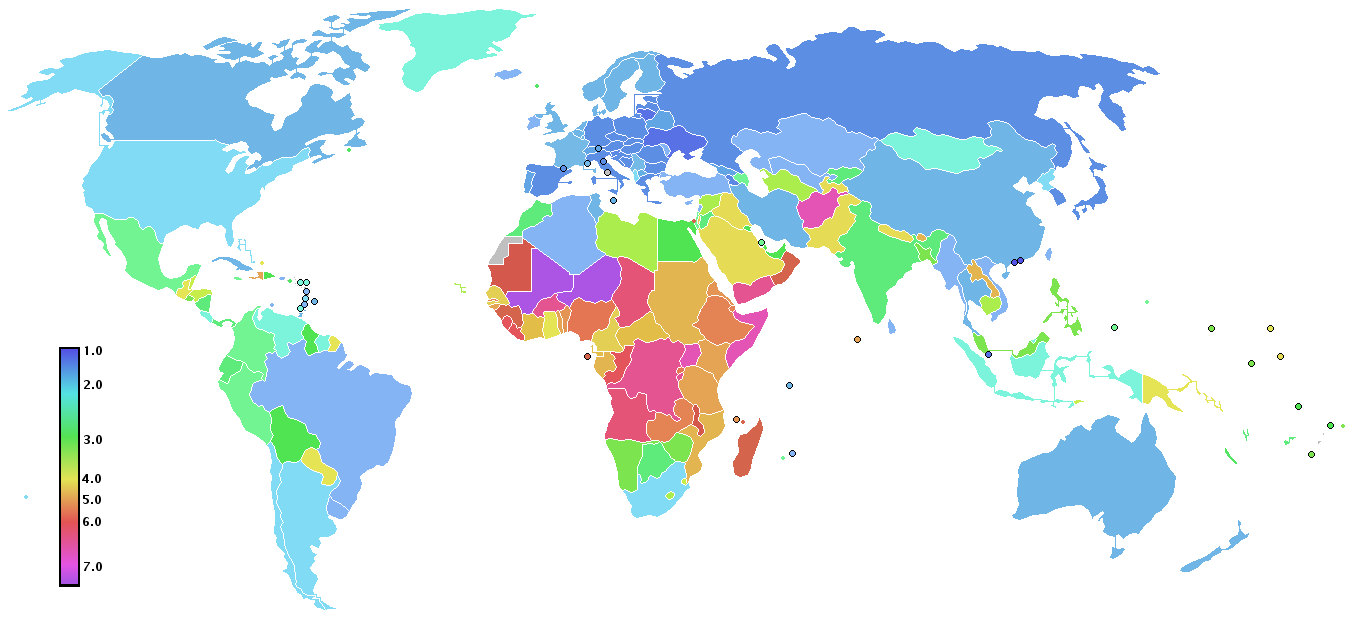
At the Global Footprint Network website, there is a map showing all countries in green or red, depending on whether they are sustainable; that is, living within their national biocapacities [7]. Looking at this map (Figure 1), we see that India is among the unsustainable countries (shown in red). It may seem a contradiction, but it is not. In India, the average footprint is small but the number of feet is high, because the country is densely populated, much more than the average for the rest of the world. As a consequence, the total Indian ecological footprint is very high too, far above the biocapacity of the Indian territory. In fact, if the entire world was as densely populated as India, about 28.53 billion people would inhabit our planet! And no, we would not be sustainable, not even if we all were as low-impacting as the average Indian citizen today.

Vice versa, Norway on the map is green: it is ecologically sustainable. Again, no contradiction. In Norway the average personal footprint is large but the number of feet is small, because population density in Norway is low, much lower than the rest of the world. If the whole world was as densely populated as Norway, less than 2 billion people would inhabit the planet. And the world would be sustainable without any need for reducing the EF.
It’s as if you had a cake to distribute to a certain number of people. If people are not too many, you can give each a big piece of cake and the cake is still enough for all. But if people are too many, there may not be enough for all, even giving each just a small piece of cake. Sustainability depends not only on the size of the pieces, but also on the number of pieces and on the size of the entire cake, which represents–in this metaphor–the available biocapacity.
To highlight this, we decided to build a different table. This time, we didn’t fix the number of people on the planet, but the per capita EF, which averages 2.75 gha for the world as a whole. Then, we computed how many Earths would be needed to be sustainable if the entire world was as densely populated as India, Norway, the USA or any other country. Results are shown in Table 2 below.

Taken together, Tables 1 and 2 provide a more complete picture of the world situation, highlighting the two main drivers of biocapacity overshoot: the size of the pieces of cake and the number of pieces that different countries take for themselves, two sides of the same coin. The question is: why has Table 2 never been built before?
Table 1 is very useful, because it shows that higher per capita EFs, which depend on consumption and technology, undermine the ecological balance of our planet. Conscientious consumer behaviour is important in achieving ecological sustainability. Nevertheless, higher population numbers play an equally important role in undermining ecological balance, as shown in Table 2. Conscientious reproductive behaviour is equally important in achieving sustainability. Why is this factor so neglected?
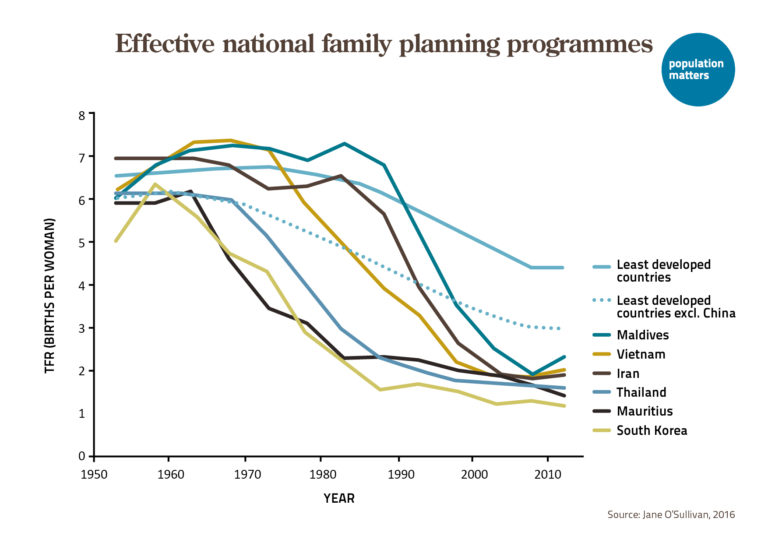
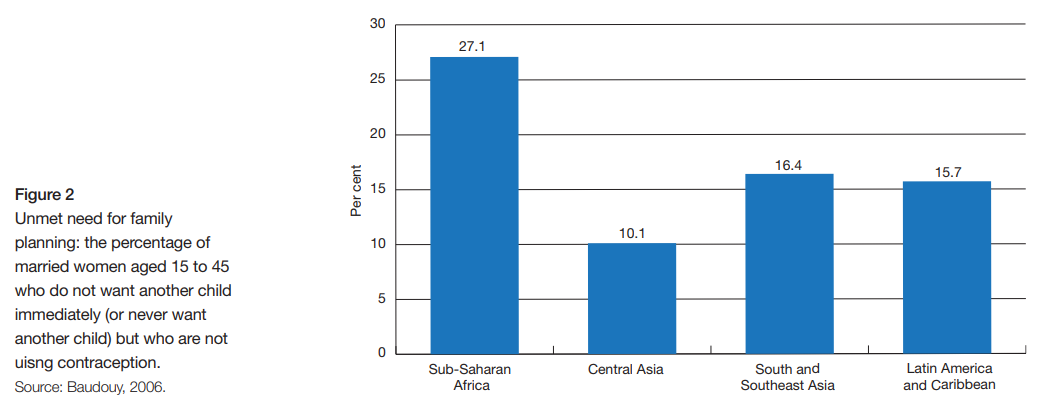
A possible answer might be that we can do something in order to reduce per-capita EF: improving technology, reducing consumption. In contrast, according to the current demographic fatalism, nothing can be done in order to reduce population. But this is not true: population numbers also result from human choices and behaviours. They can be addressed responsibly through public policy. Successful examples of voluntary family planning programs (such as those in Thailand, South Korea, and Bangladesh) show that not only is it possible to reduce fertility rates without coercive policies, but family planning programs can also improve the conditions for women and children in many countries [8, 9]. Don’t forget that lots of women have many children not because of their free choice, but through lack of choice: they are forced to marry very young, sometimes as little girls, or do not have sufficient access to contraception [10].
In order to avoid “ecological bankruptcy,” we need to face the two major drivers leading to biocapacity overshoot. Many people insist that overconsumption is the problem, not overpopulation, as though they were mutually exclusive. Instead, it is not overconsumption or overpopulation, it’s overconsumption and overpopulation. Both drivers must be acted upon, ideally simultaneously. The current reluctance to recognize overpopulation’s role risks undermining the chance to achieve sustainability, exacerbating both ecological deficit and human poverty. There are no good reasons to keep focusing only on one side of the coin. There are big risks if we keep neglecting the other.
[1] Wackernagel, M. and Rees, W. E. Our Ecological Footprint: Reducing Human Impact on the Earth. New Society Publishers, Gabriola Island, 1996.
[2] Wackernagel, M., Onisto, L., Bello, P., Linares, A. C., Falfán, I. S. L., Garcı́a, J. M., … & Guerrero, M. G. S. (1999). National natural capital accounting with the ecological footprint concept. Ecological economics, 29(3), 375-390.
[3] Andersson, J. O. and Lindroth, M.. Ecologically unsustainable trade. Ecological Economics, 37:113–122, 2001.
[4] Grazi, F., van den Bergh, J. C., & Rietveld, P. (2007). Spatial welfare economics versus ecological footprint: modeling agglomeration, externalities and trade. Environmental and Resource Economics, 38(1), 135-153.
[5] Peters, G. P., Minx, J. C., Weber, C. L., & Edenhofer, O. (2011). Growth in emission transfers via international trade from 1990 to 2008. Proceedings of the national academy of sciences, 108(21), 8903-8908.
[6] Hoekstra, A. Y., & Wiedmann, T. O. (2014). Humanity’s unsustainable environmental footprint. Science, 344(6188), 1114-1117.
[7] Global Footprint Network. National footprint accounts, 2019 edition. http://data.footprintnetwork.org, 2019.
[8] Grant, J. P. The state of the world’s children 1992, Oxford University Press for Unicef, 1993.
[9] Weisman, A. (2013). Countdown: Our last, best hope for a future on earth? Hachette UK.
[10] Sedgh, G., Ashford, L. S., & Hussain, R. (2016). Unmet need for contraception in developing countries: examining women’s reasons for not using a method. New York: Guttmacher Institute, 2, 2015-2016.


Leave a Reply