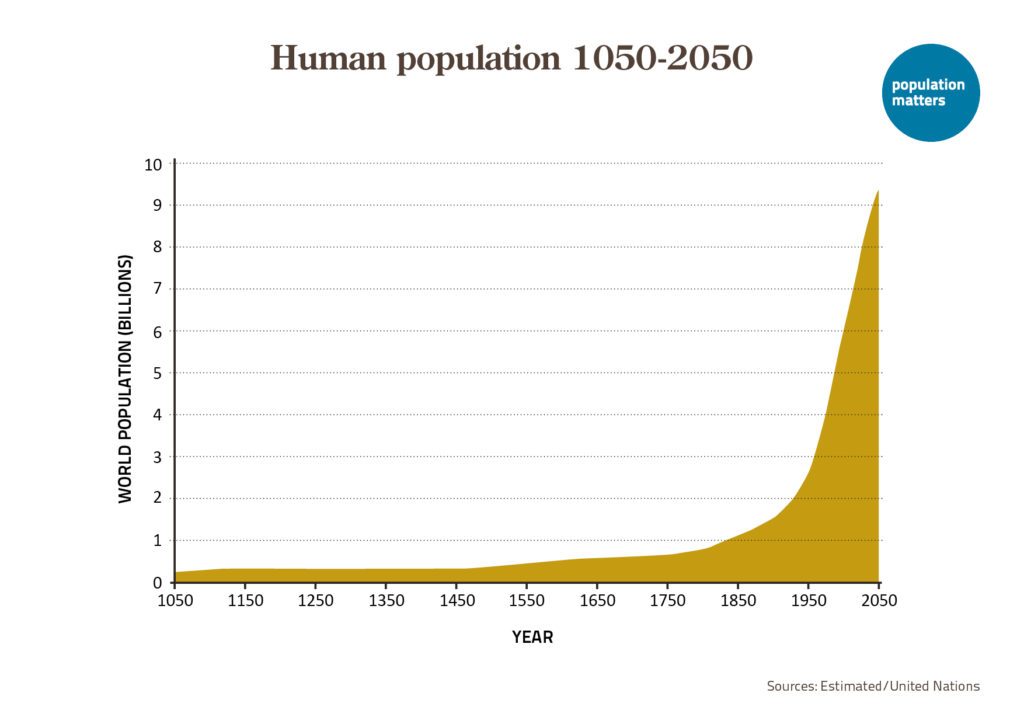
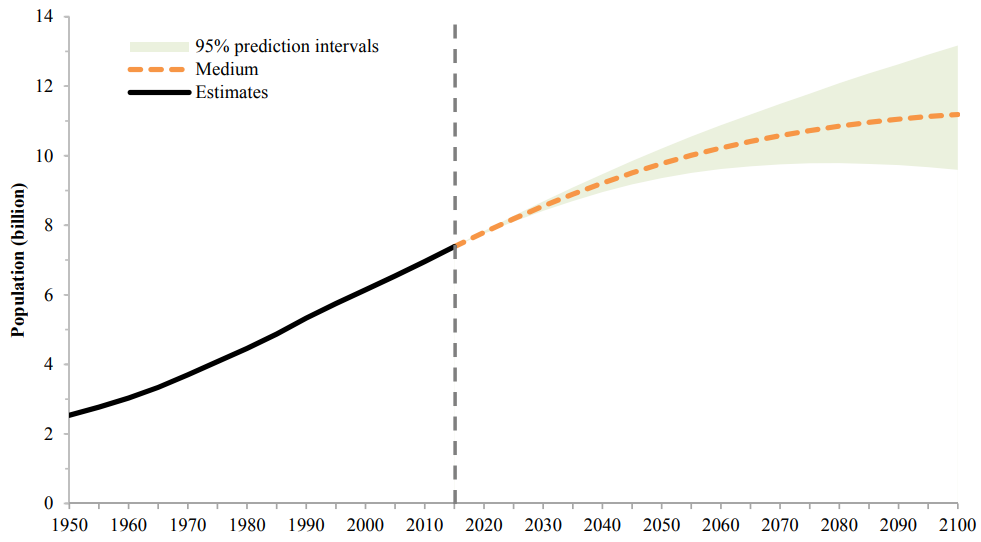
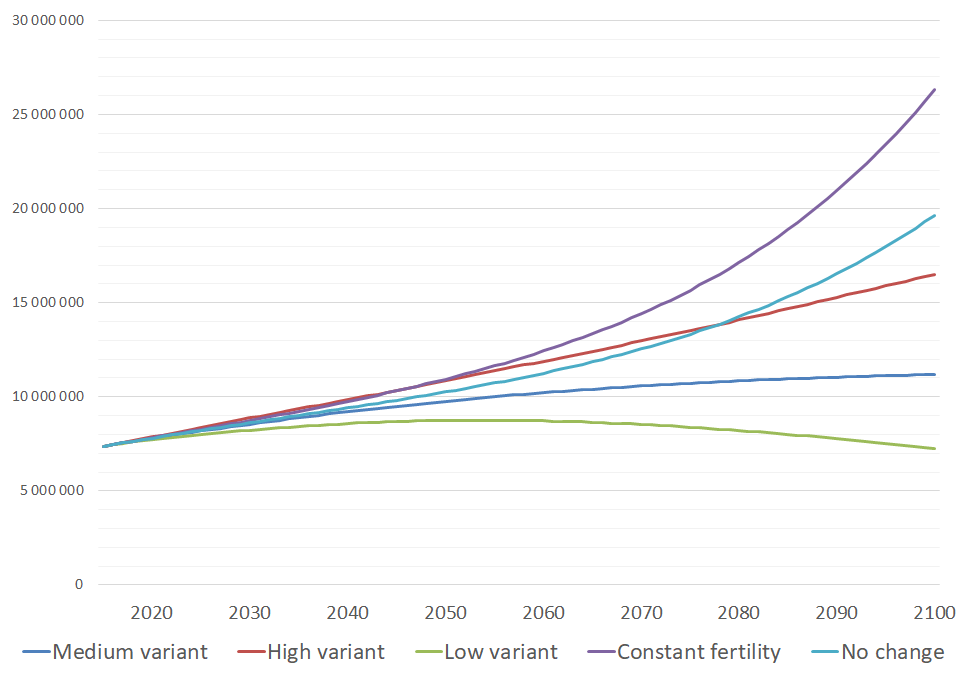
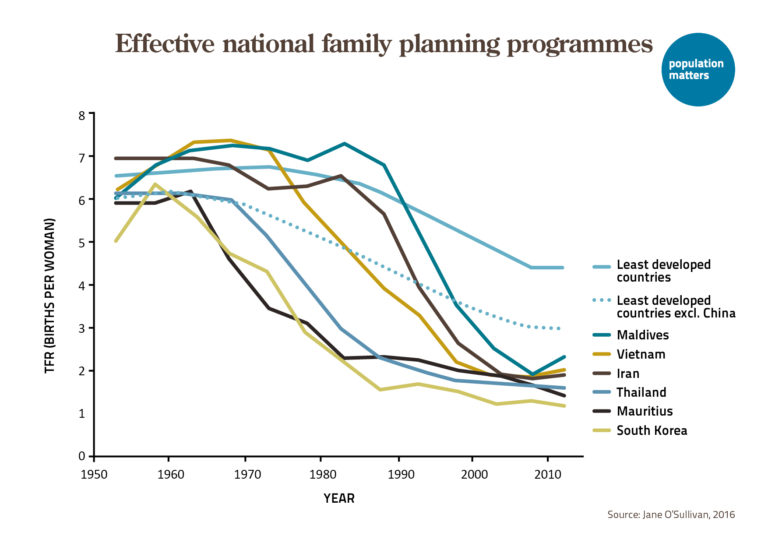
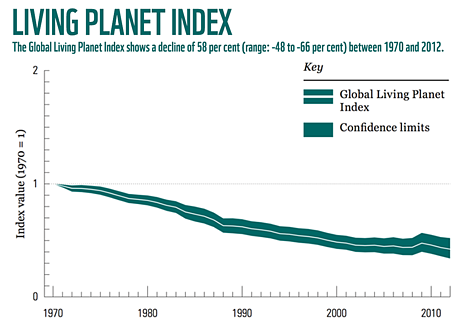
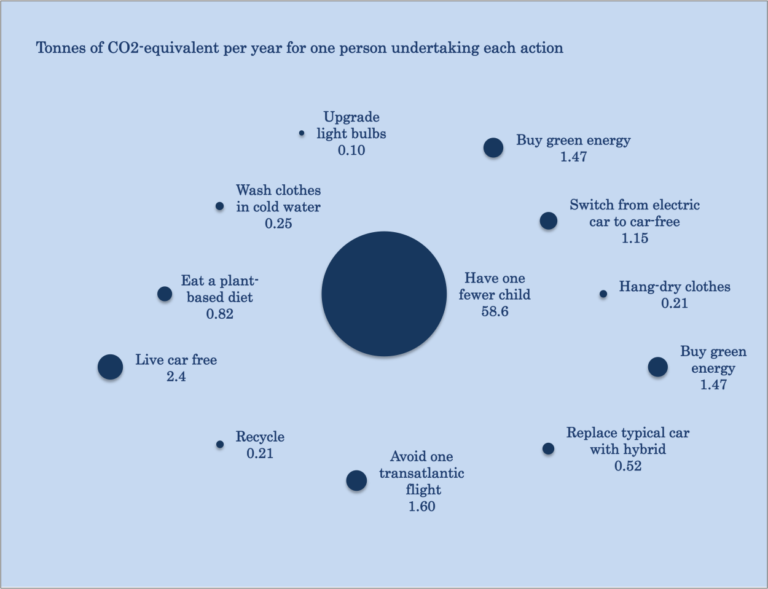
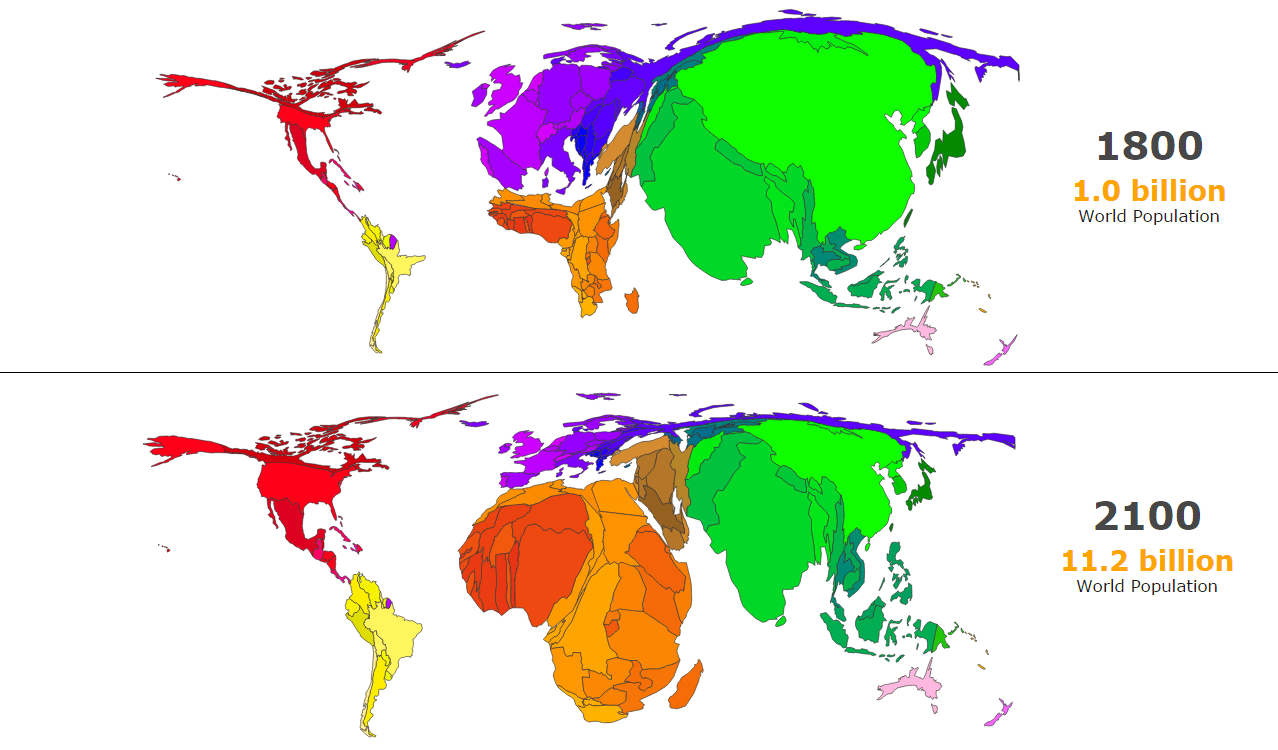
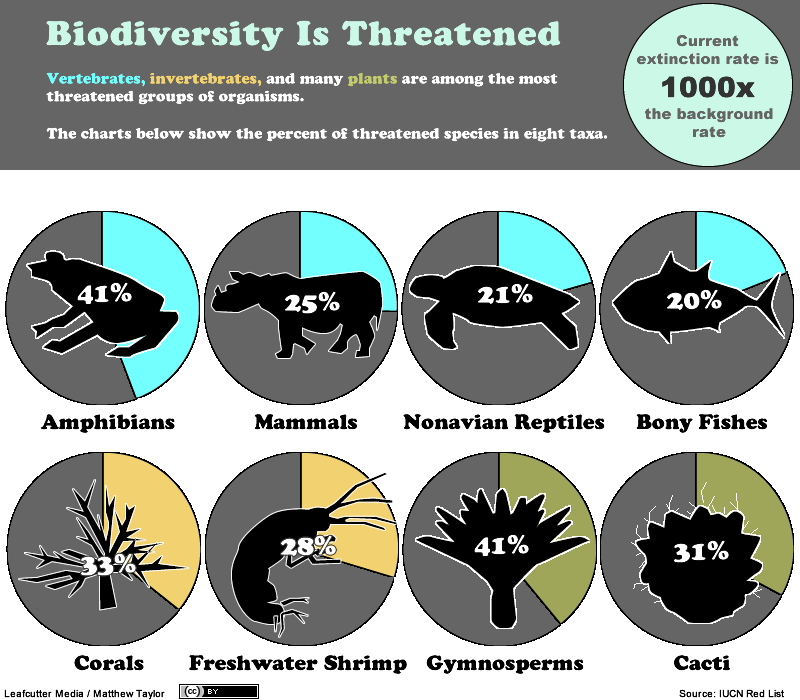
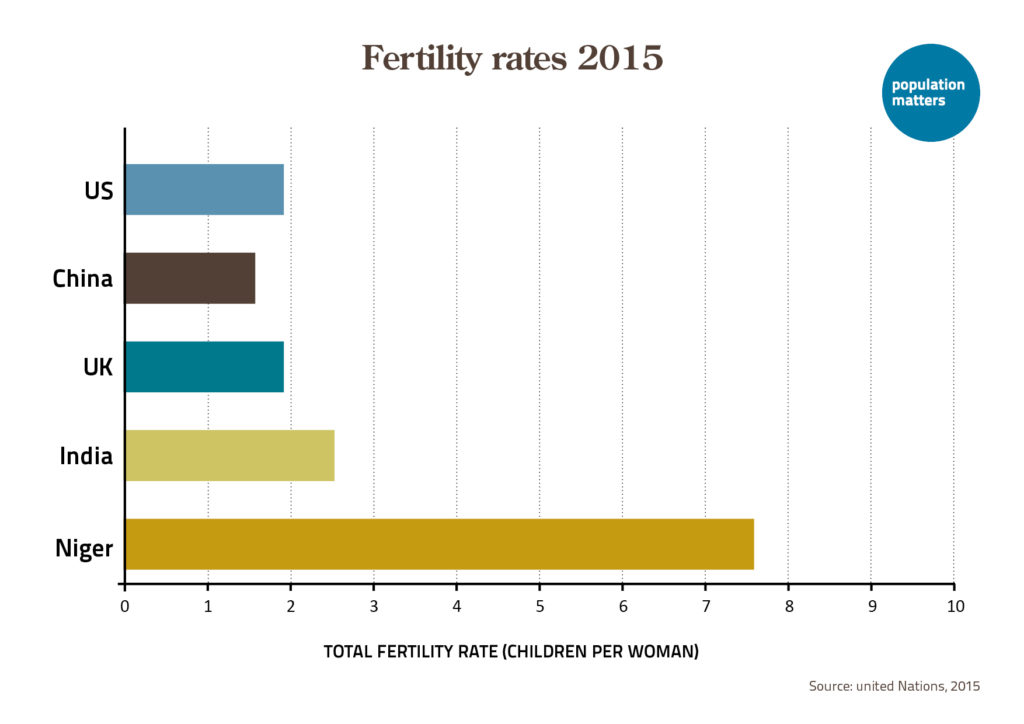
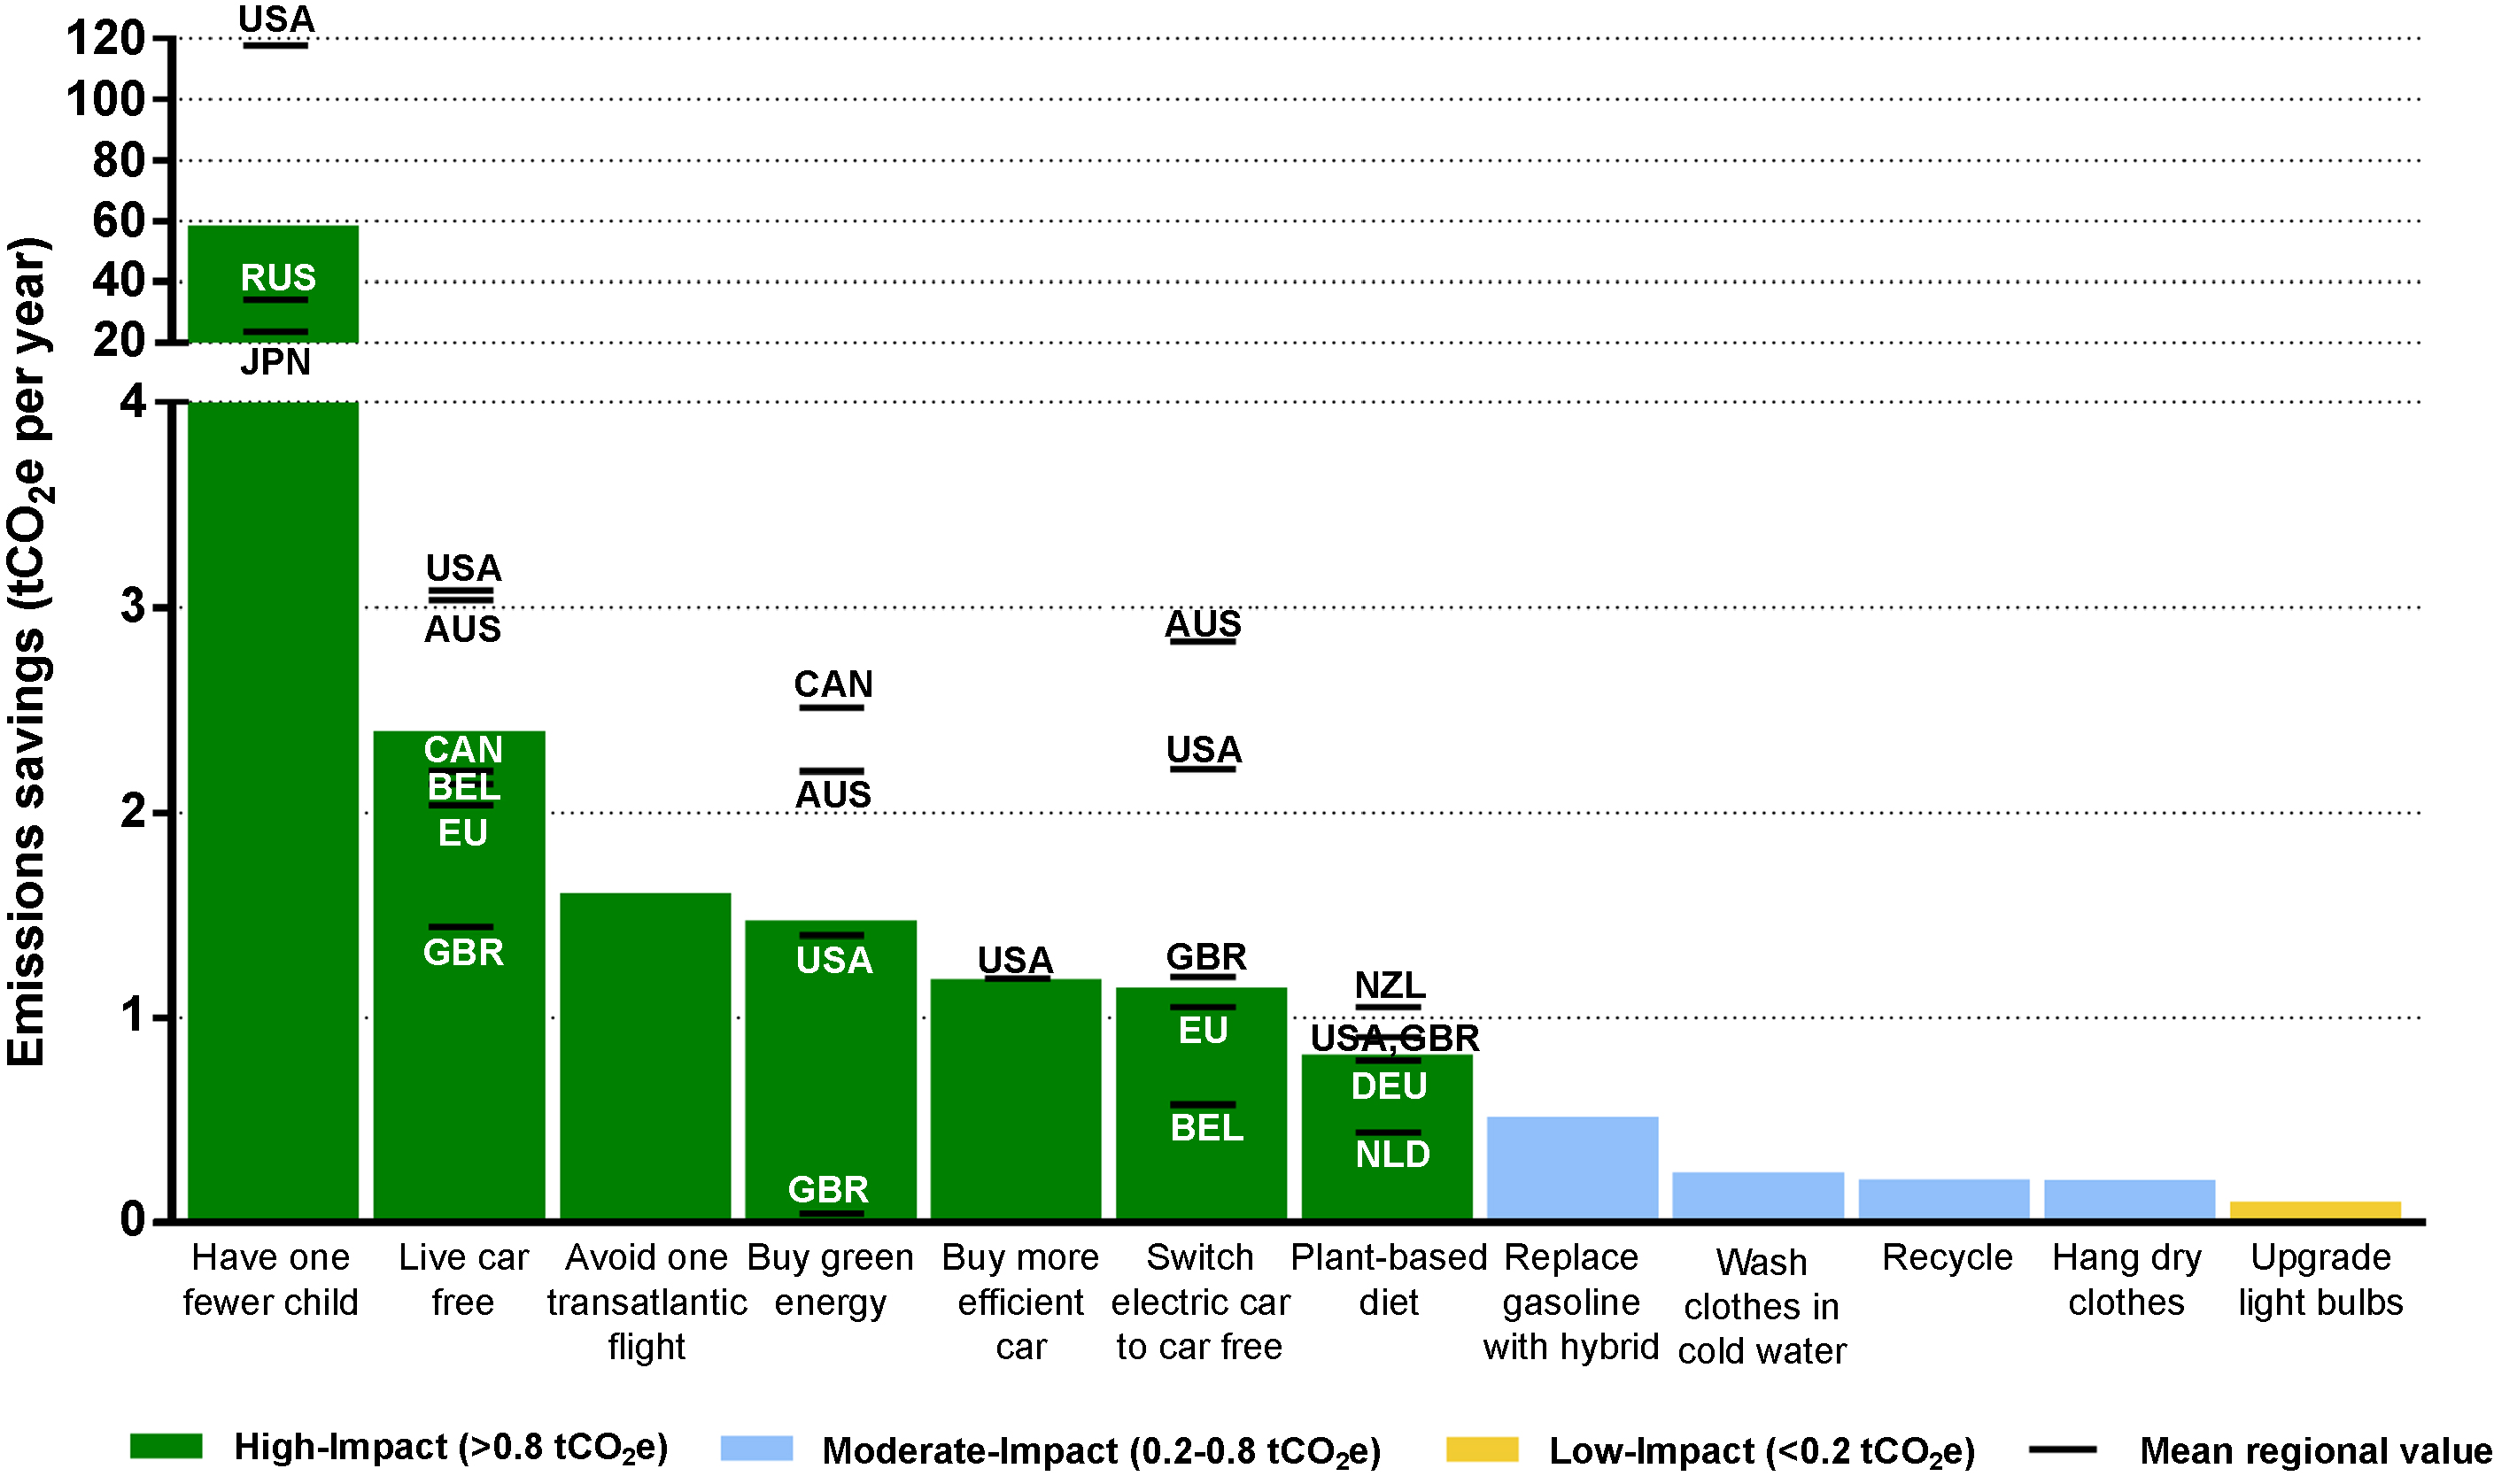
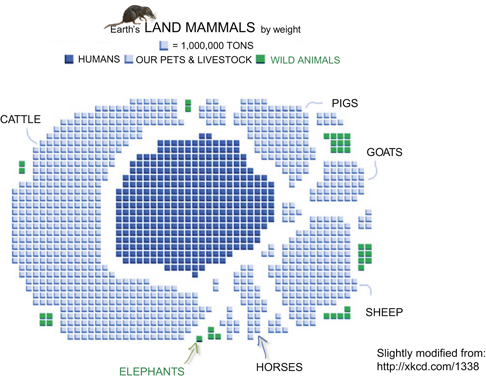
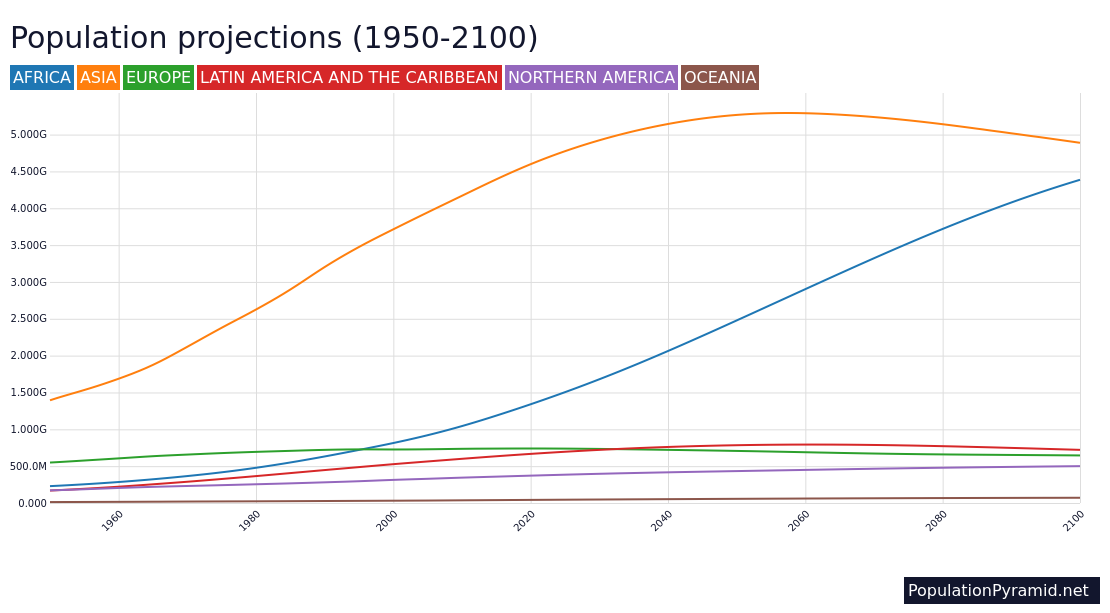
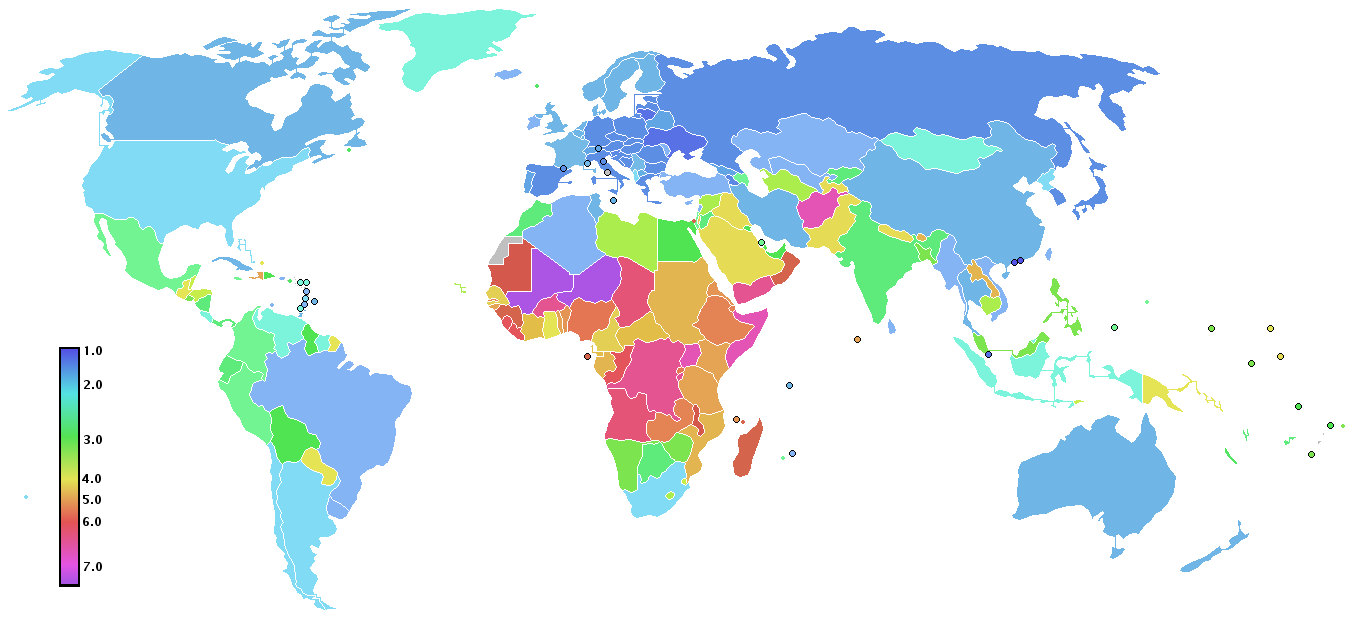
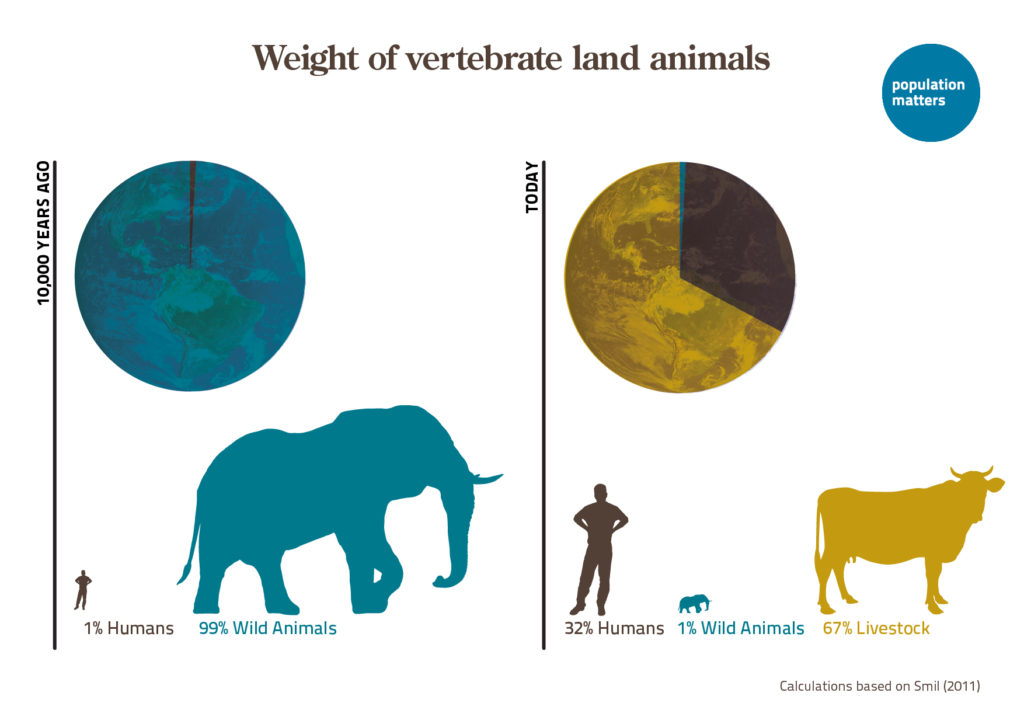
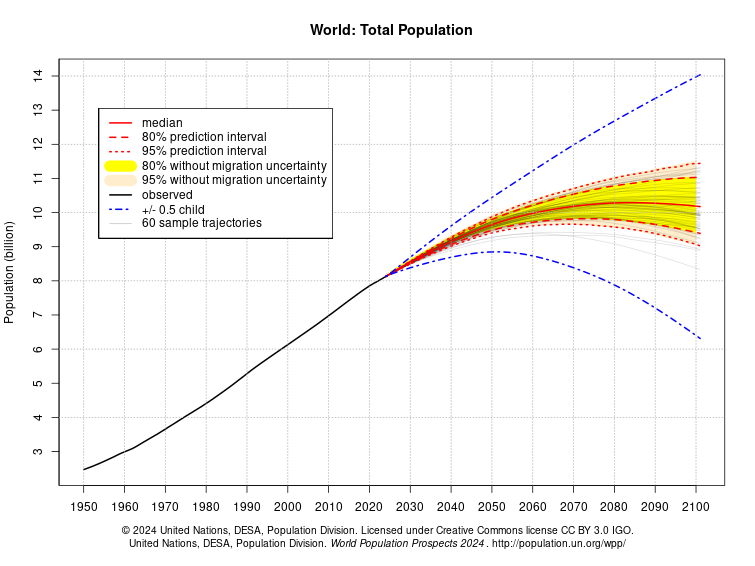
Human population of the world in billions from 10000 BCE to 2000 CE. It shows exponential rise in world population that has taken place since the eighteenth century. Source: US Census BureauHuman population of the world: estimates between 1950-2015, and medium variant projection with 95% prediction intervals between 2015-2100. Source: UN -World Population Prospects: The 2017 RevisionUnited Nations latest population projections till 2100. The variants differ in fertility levels, while mortality held constant. Source of data: World Population Prospects: The 2019 RevisionHuman population projections by the main geographical regions. Source: populationpyramid.netWorld population change 1800-2100, the country size shows the share of the population. Source: metrocosm.com based on UN: World Population ProspectsPopulation growth of countries in annual %, in 2015. Source: populationpyramid.netThe current biomass of Earth’s land mammals. Source: Smith et al. 2015 – Megafauna in the Earth system; based on Vaclav Smil: “The Earth’s Biosphere – Evolution, Dynamics, and Change”Density of human population. Source: populationpyramid.netTotal fertility rate (TFR, births per woman) represented by countries. (2015) Source: populationpyramid.netThe importance of having fewer children in climate change mitigation: a comparison of the emissions reductions from various individual actions. The height of the bar represents the mean of all studies identified in developed nations, while black lines indicate mean values for selected countries or regions. Source: Wynes and Nicholas (2017): “The climate mitigation gap: education and government recommendations miss the most effective individual actions”The Change of the Global Living Planet Index over time. It shows that the size of vertebrate populations (mammal, bird, reptile, fish and amphibian populations) declined 58% since 1970: a frightening, 2% average annual decline. Source: WWF Living Planet Index, 2016