Ecological Footprint and Sustainable Population

With humanity currently in overshoot, societal changes must be enacted to return to sustainable levels. While either a country’s ecological footprint or population size could be altered to achieve the necessary level, combined efforts on both fronts would be most effective.

By Denis Garnier, president of Démographie Responsable

A sustainable population corresponds to the total human population that the planet can support without diminishing the health of the biosphere and its ability to support humans, in the same numbers and at the same standard of living, into the future.

THE ECOLOGICAL FOOTPRINT

To assess this population, several calculation methods can be used, or even combined. In this contribution, we will confine ourselves to a single analytical element, the ecological footprint, which has the advantage of synthesising many ecological impacts caused by human activities. The concept of the footprint was initiated and refined by the Global Footprint Network (GFN) and is now the most widely used indicator of general sustainability in the environmental community and well beyond, since some countries have incorporated it into their national accounts.

According to the GFN definition, the ecological footprint measures the surface area of land required to produce the resources a population consumes and to absorb the waste it generates. This surface area is expressed in global hectares, i.e., hectares corresponding to a worldwide average. For simplicity’s sake, we will speak in hectares [ha]. An important detail is that a country’s ecological footprint only considers what is “consumed” there. It includes the footprint of imported products and subtracts the footprint of those that are exported.

The human population is putting pressure on natural systems around the globe, both on land and water.

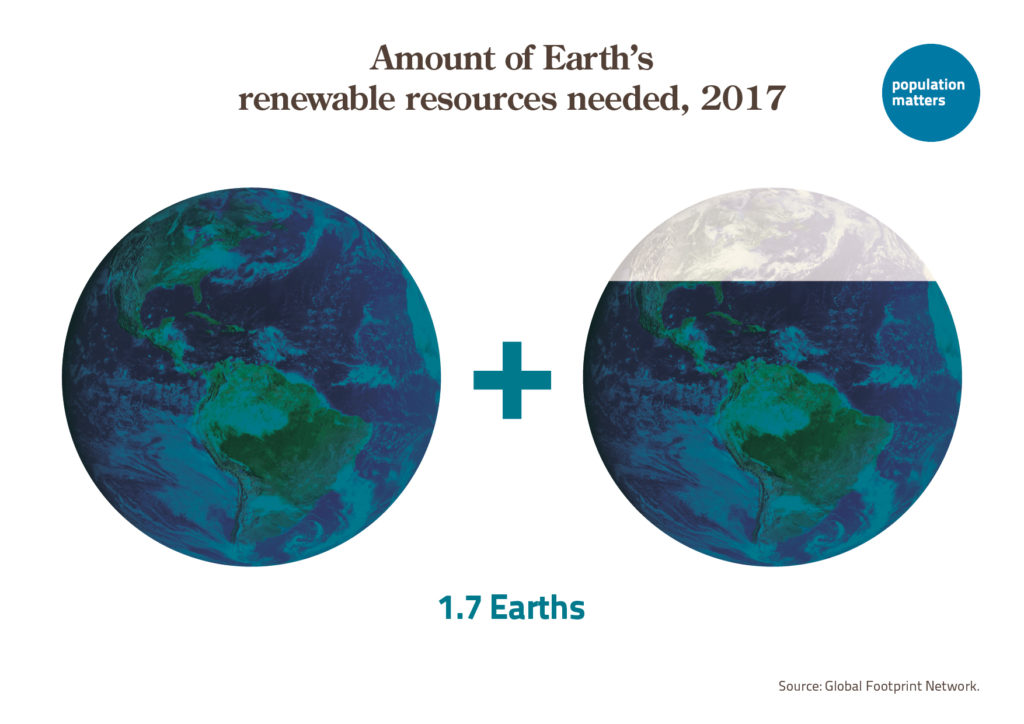
Currently, at the global level, the average footprint per person is 2.8 ha/capita (global footprint of human activities divided by world population). The problem is that we only have 1.6 ha/inhabitant, which corresponds to what the planet produces in a renewable way each year, and which is called the average individual biocapacity.

The question that immediately springs to mind is: how is it possible to have a footprint (2.8 ha) greater than the Earth’s biocapacity (1.6 ha), in other words to consume more than is produced? Well, we are quite simply drawing on the Earth’s capital: for example, we are emitting more CO2 than the oceans and forests can absorb, we are emptying the oceans of their fish, and we are sterilising arable land by concreting it over.

A KEY RATIO

– Humanity ‘uses’ 1.8 planets. To arrive at this result, we relate the fact that an earthling has a footprint of 2.8 ha while the planet only has the capacity to provide 1.6 ha [2.8 / 1.6 = 1.8].

– Similarly, the GFN calculates what each country ‘uses’ as resources by relating not the country’s footprint to its own biocapacity, but the country’s footprint to the planet’s biocapacity. This compares each country’s consumption with what would be globally sustainable. However, it is also of interest to explore how self-sufficient a country is, in terms of whether its own biocapacity is enough to supply the current consumption patterns of its current population.

This shows up how dependent they are on resources imported from elsewhere, which is a measure of overpopulation. If we compare their consumption with the planetary average biocapacity, replacing the (inevitably) low individual biocapacities of overpopulated countries with the (generally higher) biocapacities of the Earth gives these countries a false advantage. Bangladesh (with a footprint of 0.9 ha and a biocapacity of 0.4 ha) is a case in point, acting as an excellent case study since the GFN calculation [0.9 / 1.6 = 0.6] means that if everyone in the world lived like people in Bangladesh, they would use little more than half a planet. However, Bangladesh is using more than twice its own resources [0.9 / 0.4 = 2.3], by ‘drawing’ what it lacks from the rest of the planet. In what follows, in contrast to the approach taken by GFN, we will therefore focus on the ecological balance within countries by comparing their footprint with their own biocapacity.


EVOLUTION OF THE PLANET’S FOOTPRINT AND BIOCAPACITY

The planet’s overall biocapacity increases slightly from year to year, as a result of productivity improvements, mainly in agriculture. However, as the world’s population and per capita wealth continue to grow at a faster rate, the Earth’s individual biocapacity is inexorably decreasing.

The graph shows change in global hectares per capita over the years, of individual ecological footprint and individual biocapacity. In 1970, the lines crossed and we went into ecological overshoot.

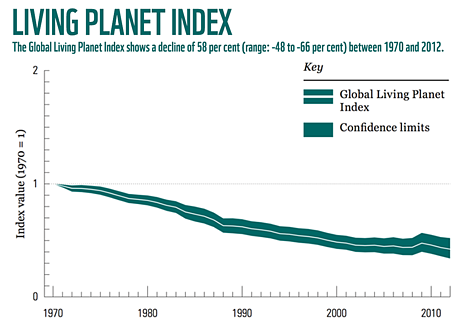
This very telling graph was published in the WWF’s “Living Planet Report” (French edition [1], page 40) in 2012 along with the caption: “The decrease in per capita biocapacity is mainly due to the increase in the world’s population: the earth’s resources have to be shared between a greater number of humans. The increase in the planet’s productivity is not enough to offset the demand of this growing population“.

It is therefore clear that the ecological overshoot in 2008 (and even more so today in 2023) is essentially due to the increase in population, which has more than doubled since the curves crossed in 1970.

COMPARING COUNTRIES AND THE PLANET

The following graph compares countries in relation to their self-sufficiency, with individual footprints on the vertical axis and “population densities per bioproductive area”[2] on the horizontal axis.

The green curve [3] corresponds to ecological balance where a country’s biocapacity is just equal to the resource use by its population, notionally representing self-sufficiency. Each line above the green line represents a multiple of the self-sufficient population, requiring use of resources equivalent to several times the bioproductive area of the country (2, 3, 4 and more).

Population density and per capita footprint of different countries, with lines denoting the level for self-sufficiency and overshoot.

With footprints above the world average, we find France close to the ‘2 countries’ curve, Germany with two and a half times its surface area, then the United Kingdom and Italy using four times their country’s biocapacity.

With individual footprints below the world average, we can see that Nigeria still uses almost twice its surface area’s worth of biocapacity, Bangladesh, Burundi, and Haiti are at two, India is slightly above, and Algeria and Egypt use four times their surface area.

On the left and ‘below’ the self-sufficiency curve are Canada, Russia, and Brazil, whose biocapacity is greater than their footprint. That said, the footprint of the first two countries is much larger than the average footprint of a person living on Earth, and it is imperative that they reduce it. Their ‘surplus’ biocapacity is needed globally to offset the countries in deficit, not least by exporting food without which other countries would starve. All three also represent important ecosystems supporting many unique species and are vital to global biodiversity.

EQUILIBRIUM SITUATIONS ACCORDING TO DIFFERENT TYPES OF POPULATION AND FOOTPRINT

1) ACTING ONLY ON THE FOOTPRINT

First, we could achieve a situation of global equilibrium if each country, whatever its biocapacity, brought its footprint down to the level of the planet’s average biocapacity. Graphically, this would involve a vertical shift of all countries towards the horizontal dotted line at 1.6 global hectares per person (see chart below). This would enable the planet’s resources to be distributed equally.

The problem is that these resources are very unevenly distributed, and this would mean continuous transfers of agricultural resources over more or less long distances, which would consume a lot of energy.

In the end, the planet would indeed be in balance, but none of the countries would be in internal balance with themselves. Another disadvantage is that, once calculated, any growth in population anywhere would reduce the consumption permitted per person everywhere.

Population density and per capita footprint of different countries, with lines denoting the level for self-sufficiency and overshoot. Arrows show how countries would need to decrease or increase their footprint to reach the average needed for global self-sufficiency.

2) ACTING ONLY ON THE POPULATION

a) Hypothetically, we consider here that debtor countries can maintain their individual footprint, but must lose inhabitants until they return to equilibrium, whereas creditor countries can have more inhabitants until they use up all their biocapacity.

Graphically, this involves a horizontal shift [4] (in the direction of the self-sufficiency curve) to the left for the former (who are the most numerous) and to the right for the latter. The calculation gives a sustainable population of 4.9 billion (remembering that this figure requires poor countries to stay poor).

Population density and per capita footprint of different countries, with lines denoting the level for self-sufficiency and overshoot. Arrows show how countries would need to decrease or increase their population to reach the average needed for global self-sufficiency.

b) However, it can be argued that since most countries will have to reduce their population, it makes no sense to allow others to grow. This leads us to a new calculation in which the creditor countries remain at the same population level (and therefore at the same place on the graph). This option would mean using only three-quarters of the planet’s biocapacity, leaving some for other species and as a safe buffer space. After calculation, this would be 3.6 billion.

Population density and per capita footprint of different countries, with lines denoting the level for self-sufficiency and overshoot. Arrows show how countries with an excessive population would need to decrease their population to reach the average for global self-sufficiency

3) ACTING ON BOTH THE FOOTPRINT AND THE POPULATION

a) The disadvantage of the previous calculation is that the footprints remain unchanged, and we end up with very different lifestyles in different countries. To remedy this, we could ensure that the balance is achieved with the same footprint and the same individual biocapacity in all countries. There are, of course, an enormous number of possibilities. Here, we have arbitrarily chosen an average footprint of 2.8 ha/capita (i.e., the current individual footprint of an earth person), which has the advantage of corresponding to an egalitarian distribution of today’s global consumption, but at a population that makes this sustainable.

Graphically, this involves shifting all the countries (and therefore the Earth) toward a single point. The sustainable population of each country would then be equal to its overall biocapacity expressed in global hectares, divided by 2.8.

It should be noted in passing that this option leads to a significant drop in the standard of living in countries with a footprint greater than 2.8. For countries with a biocapacity of less than 2.8, this option allows their quality of life to improve but consequently requires an even greater fall in population than in the previous case [5]. The result is a sustainable population of 4.4 billion.

Population density and per capita footprint of different countries, with lines denoting the level for self-sufficiency and overshoot. Arrows show a combined scenario of how countries would need to decrease or increase both population size and per capita footprint to reach the same level needed for global self-sufficiency.

b) However, as above, it may seem preferable for countries with a biocapacity greater than 2.8 ha per person to remain at the same population level. In this case, the population, using only 70% of the planet’s biocapacity, would be 3.1 billion. This assessment, which is the lowest of the four, is explained by the fact that we have chosen a “fairly high” standard of living.

Population density and per capita footprint of different countries, with lines denoting the level for self-sufficiency and overshoot. Arrows show a combined scenario of how countries in overshoot would need to alter their population size and per capita footprint to reach the average for global self-sufficiency, while countries with biocapacity surplus would increase or decrease their global per capita footprint.

CONCLUSION

We have estimated a ‘sustainable’ world population to lie between 4.9 and 3.1 billion, depending on the strategy used [6]. Based on this, we can estimate that Earth’s carrying capacity for humans lies between 3 and 5 billion.

Many scenarios can therefore be modelled based on the GFN database. The idea here is simply to show examples of calculations. It would be in every country’s interest and in line with international distributive justice to bring itself into line with its biocapacity by reducing its average individual footprint and/or its population.

If a sustainable population were recommended by the international community at a UN conference, with implementation freely consented to by each state, it would take a relatively long time to achieve. People almost everywhere (including in low-fertility but overpopulated countries) would need to be persuaded that smaller families maximise the future prospects for themselves and their children. Country leaders would need to be convinced that population decline has more advantages than disadvantages: that it is worth paying a little more of national revenue to pensions and elderly care, to avoid resource scarcity, extreme weather events caused by climate change, and the political instability and warfare that extremes of deprivation tend to trigger. We might assume that restoring global population to a sustainable level will take a couple of centuries. In the meantime, not only must the rich world begin to wind back its high per capita consumption, we need to do everything in our power to protect those productive ecosystems that remain, and use both renewable and non-renewable resources more wisely. In addition, the restoration of natural habitats and species population needs either more resources, or even fewer people than was calculated above, as the ecological footprint does not specifically take biodiversity into account.

Footnotes:

[1] https://www.wwf.fr/sites/default/files/doc-2017-09/12_rapport_lpr2012.pdf

[2] Instead of using densities expressed as the number of inhabitants per square kilometre, this new concept adjusts the area according to the biocapacity of the land compared with the global average. Hence it adjusts the area downward where unproductive or low productivity land exists, and upward where land is very fertile, to calculate the number of inhabitants per hectare on a globally standardised basis (inhab/ha). These are the ‘inverses’ of national biocapacities per person (expressed in ha/inhab).

[3] The hyperbolic shape of the curves can be explained as follows: for example, if the population density per bioproductive area is 1 inhabitant/ha, equilibrium (for self-sufficiency, the product having to be equal to 1) is achieved with a footprint of 1 ha/inhabitant. If this density is 0.5 inhabitants/ha, equilibrium is achieved with a footprint of 2 ha/capita…

[4] Downwards for countries whose footprint is larger than the Earth’s, and upwards for the others. This shift, and those that follow, can be seen graphically here: https://vu.fr/GaWJD

[5] For Bangladesh, for example, this would mean an 85% drop in population, which may seem enormous. To mitigate this drastic impression, it should be borne in mind that, in the end, the country would end up with a real population density of 163 inhabitants/km², compared with France’s 103 inhabitants/km². This difference is because Bangladesh is even more ‘fertile’ than France.

[6] The spreadsheets download automatically here: https://urlz.fr/o9MW  and  https://urlz.fr/o9Nf

Print Friendly, PDF & Email

23 responses to “Ecological Footprint and Sustainable Population”

  1. Margit Avatar

    a) I read book after book, article after article, yet nothing changes: the world population increases and so does the stress on natural resources – until Earth will say it had enough, and humans will suffer the consequences because we did not listen and did not act
    b) 3-5 billion is way too many in my opinion. What if all the species on this planet would demand equal space and use of resources with humans….. just a thought

    1. Denis Garnier Avatar

      Hi Margit,
      Current demographic projections predict 10 billion humans shortly after 2050. And so, 3 to 5 billion would already be an excellent thing for the planet and ourselves.
      Otherwise, this 5 billion actually leaves little room for other species and we must obviously prefer the number of 3 billion, and why not below if the humans who will be contemporary at this stage decide so.

      1. gaiabaracetti Avatar

        Hi Denis, do you know if demographers are looking into potential increases in death rates, too? It might just be the news, but it sure looks like we’re killing each other a lot these days

      2. Denis Garnier Avatar

        Hi gaiabaracetti,
        There are a little more than 200,000 people on Earth every day (births minus deaths) and fortunately the numerous conflicts which are bloodying the world are causing significantly fewer victims. Generally speaking, throughout history, wars and epidemics have had little impact on population growth.
        Conversely, we can still cite the Black Death of the mid-14th century which decimated around half of the European population and of course the two world wars which had a significant impact on this same continent.

      3. Edith Crowther Avatar

        Yes 3 billion max, because we all use up so much more in the way of resources than we did when world population was 3 billion in 1950. An estimated total of 70–85 million people perished in World War II, or about 3% of the 2.3 billion people in the world in1940. As you can see, there was barely a hiccup in population rise in spite of that 70 to 85 million extra deaths due to War. Indeed, 100 million is nothing compared with 1000 million (1 billion).
        I must point out that the so-called “poor” countries are consuming more per capita these days, so many former Third World (Tiers Monde) nations are in worse Overshoot than many First World nations. Meantime, the numbers of destitute people consuming nothing much in the First World is soaring. So I think it is very “last century” to speak of rich countries and poor countries.
        I wonder what the French is for “Overshoot”? I hope it is not Overshoot !!!!!! That would be awful. This is such an important word and concept that I think it should be well-known in every language still alive (many languages have died recently). And it should NOT be “Overshoot” in other languages. It is a small detail – but diversity of language is as important as diversity of species.

  2. jmalpert Avatar

    Thanks for all the computational effort. However only the people who get fed live. The number who get fed in 2100 after a loss of fossil fuel without replacement is 600 million. Please help me confirm or deny the numbers in this 10 minute SKIL video.
    Civilization’s: “Running out of gas” story.
    youtu.be/b5z5R6xqEG0

  3. Kelvin Thomson Avatar

    In your charts of country by country footprint and bio capacity, you don’t have Australia. Do you have data for it, and if so, where does it lie? Kelvin Thomson

    1. Denis Garnier Avatar

      Hi Kelvin,
      To place Australia on the graph, you need to know that its individual ecological footprint is 7.1 ha, and that its individual biocapacity is 11.5 ha, and therefore that its population density per bioproductive area is close to 0,1 (= 1 / 11.5).
      Australia is therefore at the intersection of a horizontal line passing nearly 7ha/inhabitant and a vertical line passing through 0.1 inhabitant/ha. As this 0.1 is not easy to identify, we can say that it is directly above Canada, a little further to the right.
      Now, even if Australia is a creditor country (biocapacity > footprint), this footprint is completely excessive compared to the average footprint of an earthling (2.8 ha) and therefore just like Canadians, for reasons of fairness, the australians must make great efforts to reduce it.

      1. Philip Cafaro Avatar

        Denis’s explanation gets to an interesting question: in thinking about the sustainability or unsustainability of our societies, should we look to national resources and biocapacity, or global resources and biocapacity?

        My sense is that both perspectives are necessary, we should think of ourselves as citizens of France, Australia, or the US, and as citoyens du monde. Australians and Americans are big fat hogs from a global perspective. From a national perspective we look somewhat better — but really, only if we assume that all our national resources are ours for the taking, and that we don’t owe it to other species to leave them a reasonable amount. Once you consider our immense negative impacts on our fellow residents, other native species, we look like big fat hogs again.

      2. Edith Crowther Avatar

        Australia and Canada are ecologically completely doomed. I adore the Global Footprint guys but they need to re-configure their algorithms to the galloping pace of climate change. Canada is too far North to survive current levels of Global Warming and Australia too far South. Everyone should leave now before both vast areas become consumed by permanent fire.

  4. gaiabaracetti Avatar

    ” the ecological footprint does not specifically take biodiversity into account.” That’s one problem with footprint calculations.
    Another problem is that many areas of the world were very seriously nature-depleted even when the global population was 1 billion or lower. An example is Europe, which felt the need to conquer other continents because it had both damaged its environment and run out of resources for the standard of living that it wanted, which was much lower than today’s.
    Europeans expanding into North America found an immense biodiversity that they managed to greatly destroy even at much lower population levels than today. And lower than those possibly projected by this article: Canada, which is presented as having “extra” resources, for example deprived a great number of First Nations in Quebec of access to the rivers and their traditional lifestyles, in order to produce hydroeletric power for cities and industries. Many of those people were forced off their land and into permanent dwellings where the usual problems of suicide, obesity and alcohol abuse became rampant. And this is in a country that we’re told has resources to spare. Not to mention the Alberta tar sands, etc.
    The problem with footprint analysis is that they assume an extractive, agriculture- and industry-based lifestyle that not only ignores biodiversity, but also ignores how many traditional people in the world live and want to live.
    Data is useful but I’m beginning to think we need stories even more than data.

    1. Philip Cafaro Avatar

      All good points, Gaia. Getting back to “using just one Earth” isn’t nearly enough. We need goals that encompass leaving sufficient room for wild nature. What’s past is past, whether mistreatment of indigenes or displacement of other species. But what we can do is move forward in more just and sustainable ways.

      1. gaiabaracetti Avatar

        I think we should know the past to avoid repeating mistakes (though that never happens) and because of the shifting baseline problem, which is hugely important in environmental matters. Also, past injustices are also present injustices when it comes to issues like the treatment of indigenous peoples. They are not getting all of their land back, not going to happen, but a lot of the things we read about are still being done to them as we speak.
        I believe in blending and coexisting, both when it comes to different human groups, and humans and nature. Maybe that’s why I am more drawn to “indigenous” worldviews as opposed to modern human-nature separation views.

  5. gaiabaracetti Avatar

    Philip and Denis, I wonder how the footprint of international consumption and travel fit into this. I remember a debate about whether consumption should be “charged” on the importing or the producing countries (I don’t remember whether and how this was settled); it’s a similar thing about travel, with some countries such as Canada, Swtizerland, Denmark and Norway that emit more to travel than other people emit to travel to them, and poor island or Southern European countries for which it’s the opposite. Both are very important from an environmental and justice perspective.
    Again, footprint calculations are useful, but when you look at the details, you realise there’s so much more to environmental impacts and they are just one indicator among many…

    1. Denis Garnier Avatar

      The ecological footprint includes internal emissions (+) emissions generated by the production of imported products (-) those of exported products. The footprint of consumption and international travel is also integrated into the ecological footprint. In other words, consumption is “billed” to importing countries.

      1. gaiabaracetti Avatar

        Thanks. It makes sense, though I guess arguments could be made for both this choice, and its opposite.

  6. gaiabaracetti Avatar

    As for Philip’s “fat hog” comment above, I think that the question of agency comes up, too. Due to things like authoritarian regimes, unequal exchange rates, debt burdens, regulatory systems or the difficulties or refusal to catch up with industrialisation, and of course wars, some countries are basically forced to consume less than others and share their natural resources at discount rates, usually in favour of modern industrialised imperialistic countries such as the US, Western Europe, Russia or China (and possibly other up-and-comers).
    It’s both per capita and totally systemic. The US isn’t just getting its extra oil or rare earths or whatever by having them around on its soil. There’s a whole system in place to make sure they get to certain countries and not others, sometimes in spite of what the people of the producing countries actually want.

  7. gaiabaracetti Avatar

    Denis, thanks for the answer about wars, though I also had in mind other, smaller, conflicts (apparently higher temperatures make people more aggressive, and we’re headed that way).
    An argument could be made that wars and epidemics lead to a rebound in birth rates as people instinctively tend to make up for the losses. The post-WWII baby boom and high birth rates in refugee camps are two examples.
    I really don’t like it when people say that if we don’t bring our numbers down, “nature will do it for us” – it’s cruel, it’s an excuse to do nothing, it doesn’t work like that and even if it did, the amount of killing required to bring human numbers down that way would be truly staggering.

    1. Denis Garnier Avatar

      Gaiabaracetti, You are absolutely right, the same people who accuse us of wanting to infringe on the rights of couples or women to have a large number of children are often the same people who add that if one day there are too many of us, well nature will take care of rebalancing all of this. And as you say, this will not happen without indescribable humanitarian disasters. But hey, we’re still the bad guys.

      1. gaiabaracetti Avatar

        In the culture that is dominant today (not just in the West), the idea of and even word “limit” has a negative connotation. We should always get what we want and push against anything stopping us. When faced with disaster, we either ignore it, hoping someone else will take care of it, or see it as a new challenge to overcome to become even more powerful.
        We need to work to change that. Limits can mean wisdom, foresight, discipline; they can foster creativity, and they tell us we are not alone in this universe, there’s someone else out there that matters and should be respected.

  8. ganzettifrancesco Avatar

    First of all let me thank you Denis for this greatly explicative post; I think indeed it should be shared as it is in graphical aspects in major newspapers.

    My critic is not provocative, but a simple plane critic from a moral point of view, taking the part of the all not uman intelligent living beeings and also of future humans: this period in particular is in my view deeply wrong :

    ” On the left and ‘below’ the self-sufficiency curve are Canada, Russia, and Brazil, whose biocapacity is greater than their footprint. That said, the footprint of the first two countries is much larger than the average footprint of a person living on Earth, and it is imperative that they reduce it. Their ‘surplus’ biocapacity is needed globally to offset the countries in deficit, not least by exporting food without which other countries would starve.”

    Best option for Canadians and Russians would be to divert part of agricultural production to a sustainable forest management, letting woods to slowly take place of fields. This would be unquestionably the best option for the rest of biota on Earth and humans to come as well.This can be accomplished only by adequate and not flexible strong redction of women fertility: this leads to my second critic.
    My second critic is about means of reducing human population: why these are not mentioned at all? In my opinion the only viable alternative is acting on women fertility, reducing average number of children to 1 per woman or slighltily less, considering that not every woman wants or can have children, pardon, a single child in this case. For many reasons the only viable option both in developed and less developed countries is female sterilization after one child: full stop. Glad to read your critics.

  9. Emily Avatar

    Would a factor such as technological advancements impact or contribute to the pattern of human population growth globally?

  10. […] Garnier a publié un article (en anglais) sur le site de l’Overpopulation Project. Cet article : Ecological Footprint and Sustainable Population, reprenant les éléments de certaines de ses conférences offre une réflexion sur ce qui serait […]

Leave a Reply

This site uses Akismet to reduce spam. Learn how your comment data is processed.

Explore the content and topics covered by TOP, search here

Blog categories

Gallery of infographics – Learn more about overpopulation and environment

Discover more from The Overpopulation Project

Subscribe now to keep reading and get access to the full archive.

Continue reading