
Despite half a century of efforts to improve water quality and restore fisheries in America’s Chesapeake Bay, its ecological condition continues to decline. A new study quantifies the environmental problems within the Chesapeake Bay watershed, explores their causes, and discusses possible futures.
by Philip Cafaro
As the third largest estuary on Earth, the Chesapeake Bay is an essential nursery for global marine life, a key feeding stop on the Atlantic migratory bird flyway and a priceless resource for residents and visitors alike. Between 1982 to 2017, new development eliminated more than 12,500 square kilometers of natural and agricultural lands in the Chesapeake Bay’s watershed (Figure 1). Analysis of the most recent official data finds that most of this rural land conversion was caused by rapid population growth — a nearly six million increase during the study period — and most population growth was driven by immigration into the region.

The new study, Watershed Woes, finds that sprawling development within the Chesapeake Bay watershed (CBW) led to habitat loss and increased air and water pollution over the past four decades (Figure 2). Between 1982 and 2017, the study found:
- Over three million acres (12,140 square kilometers) of natural and agricultural land was paved over and permanently lost to development.
- Populations declined for dozens of threatened and endangered species inhabiting the watershed.
- 5.2 million tons of sediment were dumped into the Bay annually, along with urban runoff including road salts, household chemicals, microplastics, herbicides and pesticides.
- Sport and commercial fisheries such as shad and striped bass plummeted, as have oysters and blue crabs.
By reducing access to nature and increasing commute times and housing costs, sprawl also reduced area residents’ quality of life.

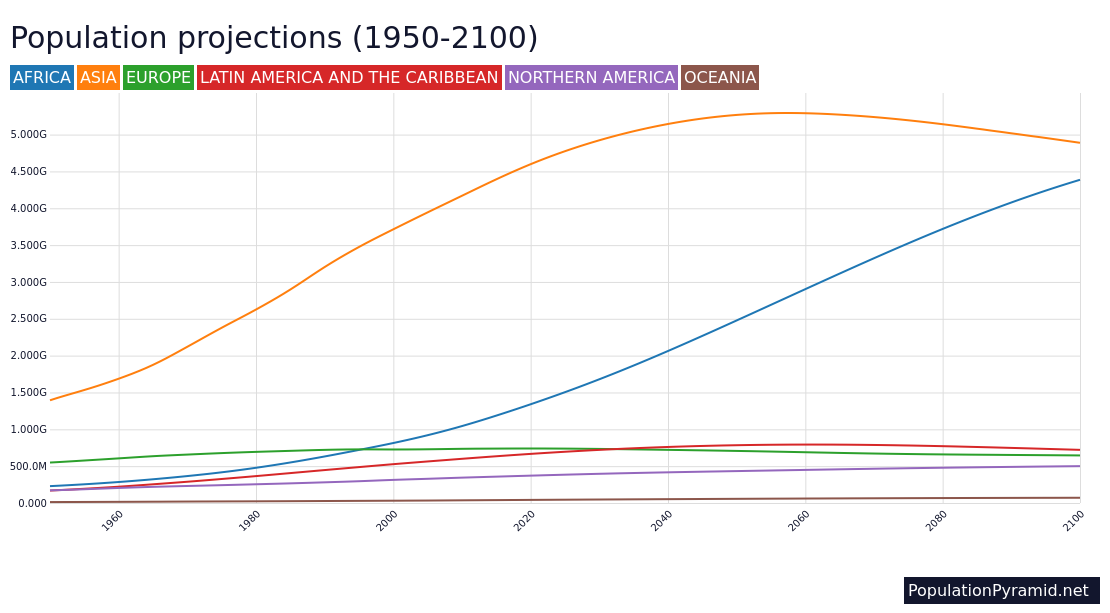
The CBW has seen many land use changes over the past forty years, including conversion of dirt and two-lane roads to paved multi-lane highways, the creation of new suburbs and towns, and recently the proliferation of data centers and associated utility infrastructures. But the most consequential change, according to the new study, has been a massive increase in the regional population (Figure 3).

Key Findings
The recently released study quantifies the loss of rural lands (both natural and agricultural areas) to urban and suburban development in the CBW. It analyzes the relative importance of the two main drivers of rural land loss: population growth and growth in per person land use. It projects future sprawl rates for the CBW based on a range of immigration levels and associated population growth rates. And it considers the likely ecological impacts of different population policies going forward. Among its findings:
Sprawl is devouring rural land in the CBW at a rapid and unacceptable rate
Between 1982 and 2017, according to the most recent data from the U.S. National Resources Conservation Service, 3,228,600 acres (13,066 square kilometers) of natural and agricultural land were converted to developed uses in the CBW. 84 percent of all sprawl in the CBW occurred in three of the six watershed states: Virginia (36%), Pennsylvania (31%), and Maryland (17%) (Table 1).
Table 1. Amount and Sources of Sprawl in CBW Watershed Counties and Municipalities, 1982-2017

The area of developed land in the CBW increased by 71% during the study period. Although official figures are not yet available for the eight years since 2017, it appears development has continued apace in the region.
Population growth is the main driver of sprawl in the watershed
The study compared changes in per capita land use, which are influenced by multiple factors, with the single factor of population. The latter increased by 5.9 million in the CBW from 1982 to 2017, a 37% increase. Analysis of recent data finds that 58% of rural land conversion was caused by population growth, with 42% caused by increased per person land use (Figure 4). Both factors thus appear to be important in driving overall sprawl.

In a more recent 15-year subset of the study period, 2002-2017, the study found population growth accounted for 71% of the 3005 square kilometers of sprawl in the watershed, while growth in per capita developed land use caused only 29%. Thus population growth’s role as a driver of sprawl appears to have become more pronounced over time.
In the future, the scale of rural lands lost to development in the CBW will depend primarily on whether the region’s population continues to grow
Per capita land use has been increasing in the Chesapeake Bay watershed over the past four decades. Assuming this problem can be solved, Figure 5 shows rural land loss in the CBW by 2100 under three population scenarios, based on three plausible immigration regimes.

Under Scenario 1 with modest population growth, total developed land would increase from approximately 7.8 million acres to 8.6 million acres in the CBW (a 10% increase). Under Scenario 2 with significant population growth, developed land would increase to 11.4 million acres (a 46% increase). Under Scenario 3 with rapid population growth, developed land would sprawl to 14.1 million acres (an 81% increase), or 6.3 million more acres lost to development.
In the future, whether the CBW’s population grows or stabilizes will largely be determined by U.S. immigration levels
During the study period, the population of the CBW increased at essentially the same rate as the U.S. as a whole (38% and 40% respectively) and the authors assume that in the future these populations will continue to move roughly in tandem. With U.S. fertility rates projected to remain well below replacement level, future population growth in the CBW will primarily be a function of future immigration levels. Figure 6 depicts projected population growth in the CBW under three plausible scenarios of annual net national immigration: one million, two million and three million. All three scenarios hold fertility rates steady and gradually increase longevity.

At one million annual net migration nationwide, the CBW population would increase by 2.1 million to 24.0 million by 2100, or an increase of 10%. At two million annual net migration, population increases by 9.9 million to 31.8 million, or an increase of 45%. And at three million annual net migration, the CBW population would increase by 17.5 million to 39.4 million, or an increase of 80%.
Policy Implications
As a wise person once said, “an estuary provides a report card on its watershed.” Another recent report about the estuary, from the non-profit Chesapeake Bay Project, confirms that the six watershed states are failing to protect the CBW or restore the Bay to health. This new report card gave area governments a C grade for protecting wetlands, a D for phosphorus pollution in the Bay and an F for water clarity and preserving the region’s oysters and anadromous fish stocks.
In response, the report’s authors advocate better land use planning, tightened pollution controls and efforts to restore degraded lands. All these efforts are necessary. But so is ending sprawl.
State and local “smart growth” efforts could in theory reduce sprawl somewhat through good planning, zoning and transportation policies, although to date they have failed to prevent additional people from using even more land per person. But, even if successful, such efforts are bound to be swamped if the U.S. population continues to increase by many millions every decade, with significant numbers of these additional residents seeking a home within the Chesapeake Bay watershed.
Watershed Residents Speak
The good news is that the region’s residents support strong action to rein in sprawl. In conjunction with this study, NumbersUSA commissioned a randomized, controlled poll of 1030 likely voters from across the CBW. Of note, 80 percent or more of poll respondents were concerned about sprawl and rapid population growth in the Chesapeake Bay watershed and more than 90 percent of respondents believe it is important to protect remaining farmland, forests, wetlands and open spaces from development. Three quarters of respondents believe recent population growth in the Chesapeake Bay region has been too rapid and should be slowed, while a majority believe the federal government should reduce immigration as part of doing so.
The science is clear. The people have spoken. Will the politicians listen?
A healthy and vibrant Chesapeake Bay is within reach (Figure 7) — but only if Americans are willing to limit their own numbers.


Leave a Reply